

5.3 Corundum Aggregated UHPCC Target
131
0
20
40
60
80
100
120
140
160
180
102.5 MPa
110.7 MPa
128.8 MPa
(106)
(145)
(88)
(106)
(101)
(98)
DOP (mm)
Volumetric ratio 30%
Volumetric ratio 45%
(a)
(b)
1-1 1-2 5-1 5-2
4-1 4-2
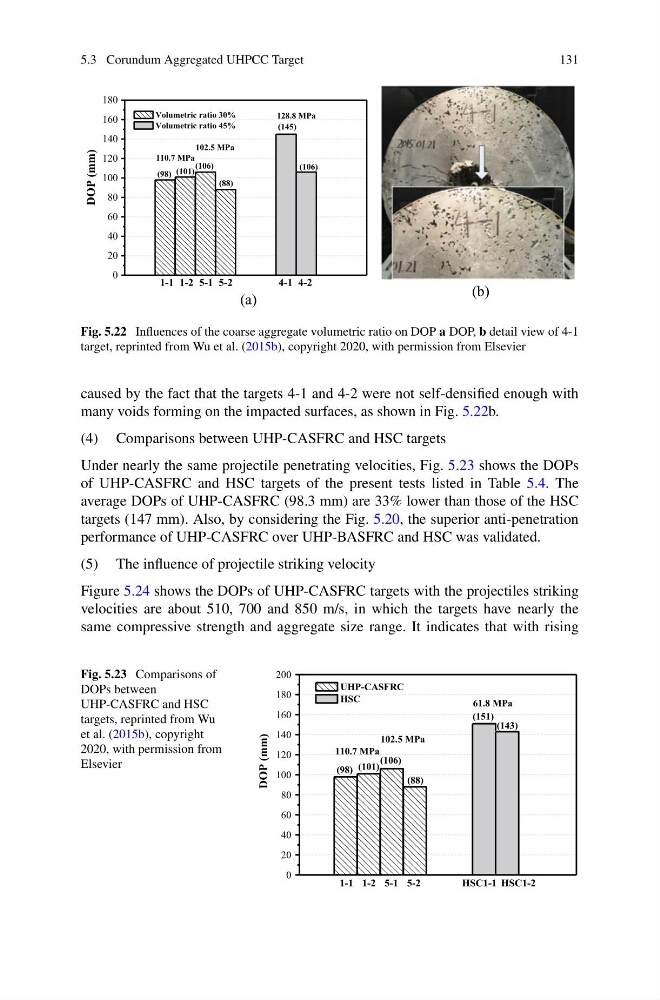
Fig. 5.22 Influences of the coarse aggregate volumetric ratio on DOP a DOP, b detail view of 4-1
target, reprinted from Wu et al. (2015b), copyright 2020, with permission from Elsevier
caused by the fact that the targets 4-1 and 4-2 were not self-densified enough with
many voids forming on the impacted surfaces, as shown in Fig. 5.22b.
(4) Comparisons between UHP-CASFRC and HSC targets
Under nearly the same projectile penetrating velocities, Fig. 5.23 shows the DOPs
of UHP-CASFRC and HSC targets of the present tests listed in Table 5.4. The
average DOPs of UHP-CASFRC (98.3 mm) are 33% lower than those of the HSC
targets (147 mm). Also, by considering the Fig. 5.20, the superior anti-penetration
performance of UHP-CASFRC over UHP-BASFRC and HSC was validated.
(5) The influence of projectile striking velocity
Figure 5.24 shows the DOPs of UHP-CASFRC targets with the projectiles striking
velocities are about 510, 700 and 850 m/s, in which the targets have nearly the
same compressive strength and aggregate size range. It indicates that with rising
Fig. 5.23 Comparisons of
DOPs between
UHP-CASFRC and HSC
targets, reprinted from Wu
et al. (2015b), copyright
2020, with permission from
Elsevier
0
20
40
60
80
100
120
140
160
180
200
102.5 MPa
110.7 MPa
61.8 MPa
(143)
(151)
(88)
(106)
1-1 1-2 5-1 5-2
HSC1-1 HSC1-2
(101)
(98)
DOP (mm)
UHP-CASFRC
HSC
131
0
20
40
60
80
100
120
140
160
180
102.5 MPa
110.7 MPa
128.8 MPa
(106)
(145)
(88)
(106)
(101)
(98)
DOP (mm)
Volumetric ratio 30%
Volumetric ratio 45%
(a)
(b)
1-1 1-2 5-1 5-2
4-1 4-2
Fig. 5.22 Influences of the coarse aggregate volumetric ratio on DOP a DOP, b detail view of 4-1
target, reprinted from Wu et al. (2015b), copyright 2020, with permission from Elsevier
caused by the fact that the targets 4-1 and 4-2 were not self-densified enough with
many voids forming on the impacted surfaces, as shown in Fig. 5.22b.
(4) Comparisons between UHP-CASFRC and HSC targets
Under nearly the same projectile penetrating velocities, Fig. 5.23 shows the DOPs
of UHP-CASFRC and HSC targets of the present tests listed in Table 5.4. The
average DOPs of UHP-CASFRC (98.3 mm) are 33% lower than those of the HSC
targets (147 mm). Also, by considering the Fig. 5.20, the superior anti-penetration
performance of UHP-CASFRC over UHP-BASFRC and HSC was validated.
(5) The influence of projectile striking velocity
Figure 5.24 shows the DOPs of UHP-CASFRC targets with the projectiles striking
velocities are about 510, 700 and 850 m/s, in which the targets have nearly the
same compressive strength and aggregate size range. It indicates that with rising
Fig. 5.23 Comparisons of
DOPs between
UHP-CASFRC and HSC
targets, reprinted from Wu
et al. (2015b), copyright
2020, with permission from
Elsevier
0
20
40
60
80
100
120
140
160
180
200
102.5 MPa
110.7 MPa
61.8 MPa
(143)
(151)
(88)
(106)
1-1 1-2 5-1 5-2
HSC1-1 HSC1-2
(101)
(98)
DOP (mm)
UHP-CASFRC
HSC