

5.2 Basalt Aggregated UHPCC Target
113
(a)
(b)
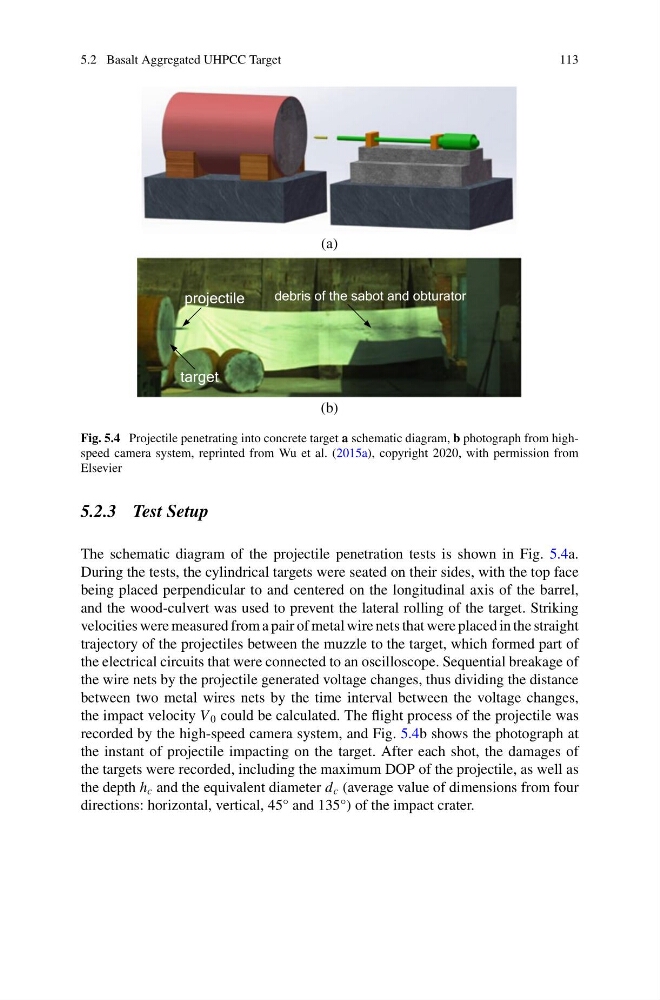
Fig. 5.4 Projectile penetrating into concrete target a schematic diagram, b photograph from highspeed camera system, reprinted from Wu et al. (2015a), copyright 2020, with permission from
Elsevier
5.2.3 Test Setup
The schematic diagram of the projectile penetration tests is shown in Fig. 5.4a.
During the tests, the cylindrical targets were seated on their sides, with the top face
being placed perpendicular to and centered on the longitudinal axis of the barrel,
and the wood-culvert was used to prevent the lateral rolling of the target. Striking
velocities were measured from a pair of metal wire nets that were placed in the straight
trajectory of the projectiles between the muzzle to the target, which formed part of
the electrical circuits that were connected to an oscilloscope. Sequential breakage of
the wire nets by the projectile generated voltage changes, thus dividing the distance
between two metal wires nets by the time interval between the voltage changes,
the impact velocity V 0 could be calculated. The flight process of the projectile was
recorded by the high-speed camera system, and Fig. 5.4b shows the photograph at
the instant of projectile impacting on the target. After each shot, the damages of
the targets were recorded, including the maximum DOP of the projectile, as well as
the depth h c and the equivalent diameter d c (average value of dimensions from four
directions: horizontal, vertical, 45° and 135°) of the impact crater.
113
(a)
(b)
Fig. 5.4 Projectile penetrating into concrete target a schematic diagram, b photograph from highspeed camera system, reprinted from Wu et al. (2015a), copyright 2020, with permission from
Elsevier
5.2.3 Test Setup
The schematic diagram of the projectile penetration tests is shown in Fig. 5.4a.
During the tests, the cylindrical targets were seated on their sides, with the top face
being placed perpendicular to and centered on the longitudinal axis of the barrel,
and the wood-culvert was used to prevent the lateral rolling of the target. Striking
velocities were measured from a pair of metal wire nets that were placed in the straight
trajectory of the projectiles between the muzzle to the target, which formed part of
the electrical circuits that were connected to an oscilloscope. Sequential breakage of
the wire nets by the projectile generated voltage changes, thus dividing the distance
between two metal wires nets by the time interval between the voltage changes,
the impact velocity V 0 could be calculated. The flight process of the projectile was
recorded by the high-speed camera system, and Fig. 5.4b shows the photograph at
the instant of projectile impacting on the target. After each shot, the damages of
the targets were recorded, including the maximum DOP of the projectile, as well as
the depth h c and the equivalent diameter d c (average value of dimensions from four
directions: horizontal, vertical, 45° and 135°) of the impact crater.