

200
M. S. Dani and I. B. Dave
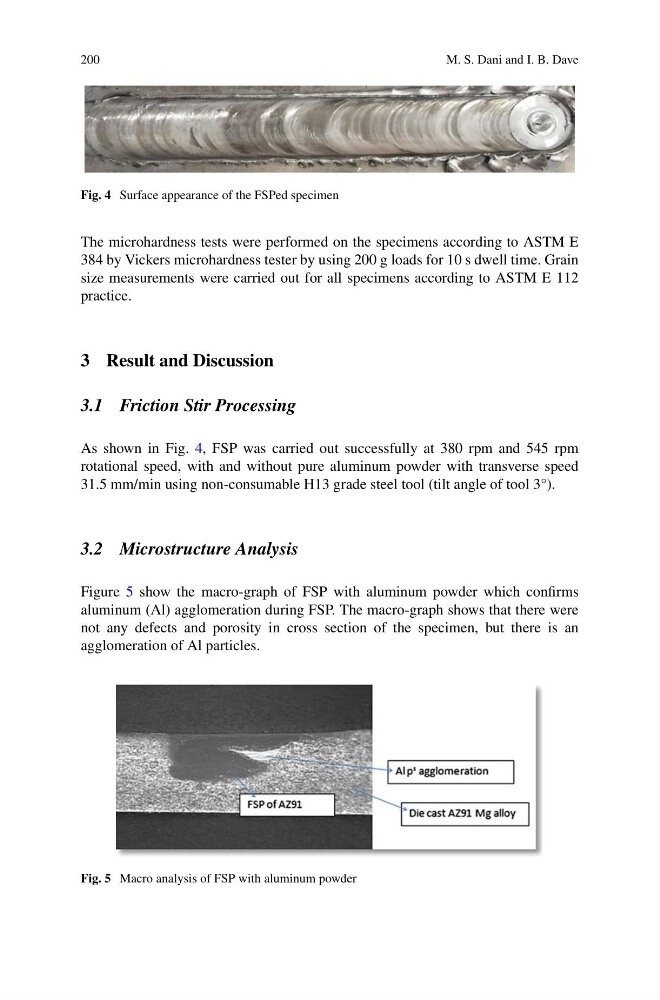
Fig. 4 Surface appearance of the FSPed specimen
The microhardness tests were performed on the specimens according to ASTM E
384 by Vickers microhardness tester by using 200 g loads for 10 s dwell time. Grain
size measurements were carried out for all specimens according to ASTM E 112
practice.
3 Result and Discussion
3.1 Friction Stir Processing
As shown in Fig. 4, FSP was carried out successfully at 380 rpm and 545 rpm
rotational speed, with and without pure aluminum powder with transverse speed
31.5 mm/min using non-consumable H13 grade steel tool (tilt angle of tool 3°).
3.2 Microstructure Analysis
Figure 5 show the macro-graph of FSP with aluminum powder which confirms
aluminum (Al) agglomeration during FSP. The macro-graph shows that there were
not any defects and porosity in cross section of the specimen, but there is an
agglomeration of Al particles.
Fig. 5 Macro analysis of FSP with aluminum powder
M. S. Dani and I. B. Dave
Fig. 4 Surface appearance of the FSPed specimen
The microhardness tests were performed on the specimens according to ASTM E
384 by Vickers microhardness tester by using 200 g loads for 10 s dwell time. Grain
size measurements were carried out for all specimens according to ASTM E 112
practice.
3 Result and Discussion
3.1 Friction Stir Processing
As shown in Fig. 4, FSP was carried out successfully at 380 rpm and 545 rpm
rotational speed, with and without pure aluminum powder with transverse speed
31.5 mm/min using non-consumable H13 grade steel tool (tilt angle of tool 3°).
3.2 Microstructure Analysis
Figure 5 show the macro-graph of FSP with aluminum powder which confirms
aluminum (Al) agglomeration during FSP. The macro-graph shows that there were
not any defects and porosity in cross section of the specimen, but there is an
agglomeration of Al particles.
Fig. 5 Macro analysis of FSP with aluminum powder