

Analysis of Dimensional Accuracy of ABS M30 Built Parts …
179
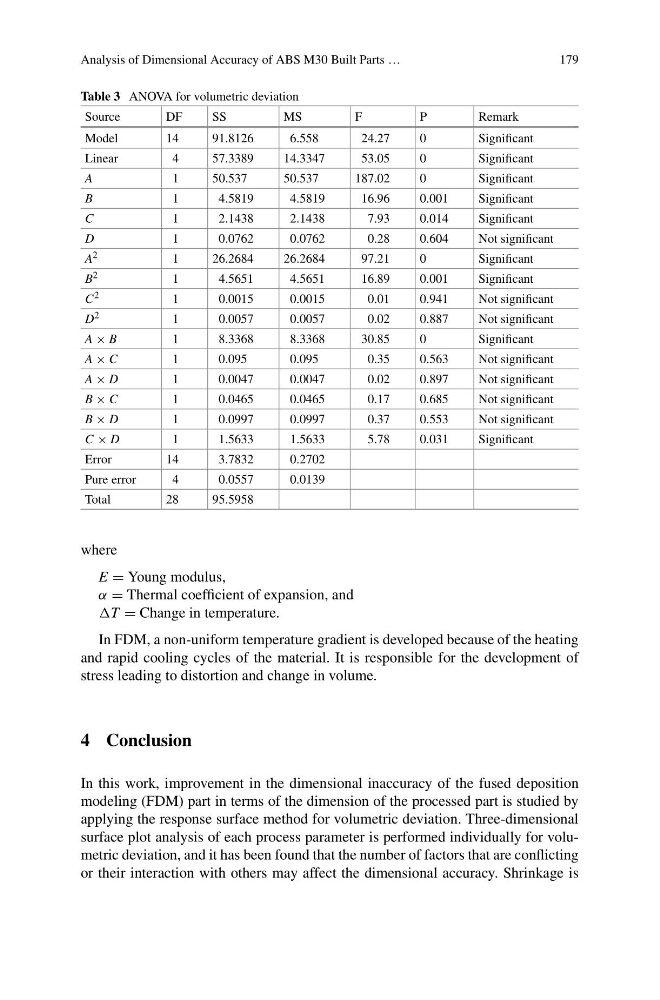
Table 3 ANOVA for volumetric deviation
Source
DF
SS
MS
F
P
Remark
Model
14
91.8126
6.558
24.27
0
Significant
Linear
4
57.3389
14.3347
53.05
0
Significant
A
1
50.537
50.537
187.02
0
Significant
B
1
4.5819
4.5819
16.96
0.001
Significant
C
1
2.1438
2.1438
7.93
0.014
Significant
D
1
0.0762
0.0762
0.28
0.604
Not significant
A 2
1
26.2684
26.2684
97.21
0
Significant
B 2
1
4.5651
4.5651
16.89
0.001
Significant
C 2
1
0.0015
0.0015
0.01
0.941
Not significant
D 2
1
0.0057
0.0057
0.02
0.887
Not significant
A × B
1
8.3368
8.3368
30.85
0
Significant
A × C
1
0.095
0.095
0.35
0.563
Not significant
A × D
1
0.0047
0.0047
0.02
0.897
Not significant
B × C
1
0.0465
0.0465
0.17
0.685
Not significant
B × D
1
0.0997
0.0997
0.37
0.553
Not significant
C × D
1
1.5633
1.5633
5.78
0.031
Significant
Error
14
3.7832
0.2702
Pure error
4
0.0557
0.0139
Total
28
95.5958
where
E = Young modulus,
α = Thermal coefficient of expansion, and
T = Change in temperature.
In FDM, a non-uniform temperature gradient is developed because of the heating
and rapid cooling cycles of the material. It is responsible for the development of
stress leading to distortion and change in volume.
4 Conclusion
In this work, improvement in the dimensional inaccuracy of the fused deposition
modeling (FDM) part in terms of the dimension of the processed part is studied by
applying the response surface method for volumetric deviation. Three-dimensional
surface plot analysis of each process parameter is performed individually for volumetric deviation, and it has been found that the number of factors that are conflicting
or their interaction with others may affect the dimensional accuracy. Shrinkage is
179
Table 3 ANOVA for volumetric deviation
Source
DF
SS
MS
F
P
Remark
Model
14
91.8126
6.558
24.27
0
Significant
Linear
4
57.3389
14.3347
53.05
0
Significant
A
1
50.537
50.537
187.02
0
Significant
B
1
4.5819
4.5819
16.96
0.001
Significant
C
1
2.1438
2.1438
7.93
0.014
Significant
D
1
0.0762
0.0762
0.28
0.604
Not significant
A 2
1
26.2684
26.2684
97.21
0
Significant
B 2
1
4.5651
4.5651
16.89
0.001
Significant
C 2
1
0.0015
0.0015
0.01
0.941
Not significant
D 2
1
0.0057
0.0057
0.02
0.887
Not significant
A × B
1
8.3368
8.3368
30.85
0
Significant
A × C
1
0.095
0.095
0.35
0.563
Not significant
A × D
1
0.0047
0.0047
0.02
0.897
Not significant
B × C
1
0.0465
0.0465
0.17
0.685
Not significant
B × D
1
0.0997
0.0997
0.37
0.553
Not significant
C × D
1
1.5633
1.5633
5.78
0.031
Significant
Error
14
3.7832
0.2702
Pure error
4
0.0557
0.0139
Total
28
95.5958
where
E = Young modulus,
α = Thermal coefficient of expansion, and
T = Change in temperature.
In FDM, a non-uniform temperature gradient is developed because of the heating
and rapid cooling cycles of the material. It is responsible for the development of
stress leading to distortion and change in volume.
4 Conclusion
In this work, improvement in the dimensional inaccuracy of the fused deposition
modeling (FDM) part in terms of the dimension of the processed part is studied by
applying the response surface method for volumetric deviation. Three-dimensional
surface plot analysis of each process parameter is performed individually for volumetric deviation, and it has been found that the number of factors that are conflicting
or their interaction with others may affect the dimensional accuracy. Shrinkage is