

Analysis of Dimensional Accuracy of ABS M30 Built Parts …
177
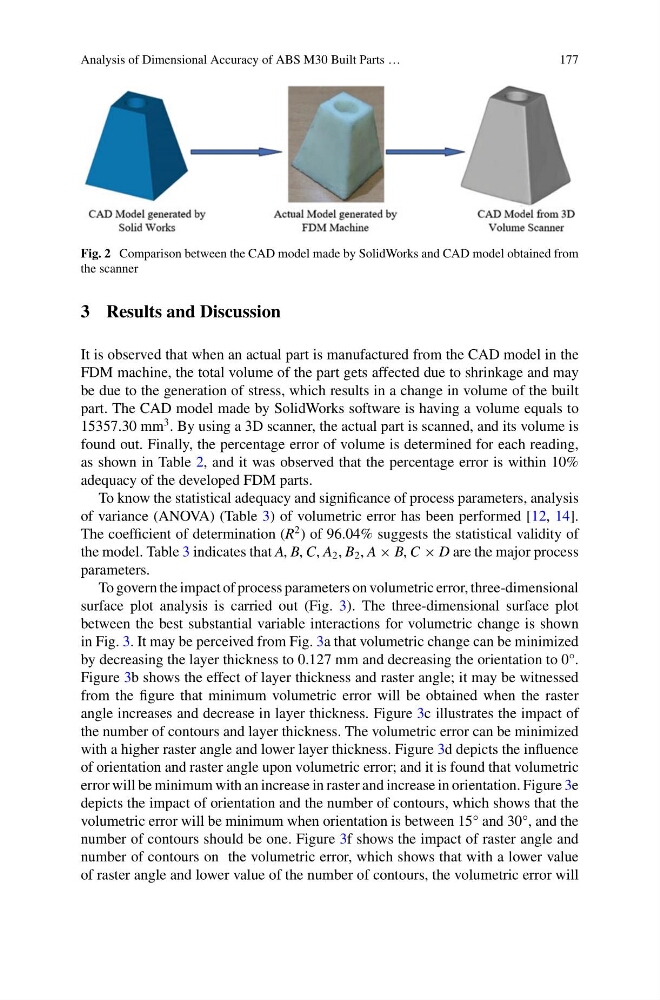
Fig. 2 Comparison between the CAD model made by SolidWorks and CAD model obtained from
the scanner
3 Results and Discussion
It is observed that when an actual part is manufactured from the CAD model in the
FDM machine, the total volume of the part gets affected due to shrinkage and may
be due to the generation of stress, which results in a change in volume of the built
part. The CAD model made by SolidWorks software is having a volume equals to
15357.30 mm
3 . By using a 3D scanner, the actual part is scanned, and its volume is
found out. Finally, the percentage error of volume is determined for each reading,
as shown in Table 2, and it was observed that the percentage error is within 10%
adequacy of the developed FDM parts.
To know the statistical adequacy and significance of process parameters, analysis
of variance (ANOVA) (Table 3) of volumetric error has been performed [12, 14].
The coefficient of determination (R
2 ) of 96.04% suggests the statistical validity of
the model. Table 3 indicates that A, B, C, A 2 , B 2 , A × B, C × D are the major process
parameters.
To govern the impact of process parameters on volumetric error, three-dimensional
surface plot analysis is carried out (Fig. 3). The three-dimensional surface plot
between the best substantial variable interactions for volumetric change is shown
in Fig. 3. It may be perceived from Fig. 3a that volumetric change can be minimized
by decreasing the layer thickness to 0.127 mm and decreasing the orientation to 0°.
Figure 3b shows the effect of layer thickness and raster angle; it may be witnessed
from the figure that minimum volumetric error will be obtained when the raster
angle increases and decrease in layer thickness. Figure 3c illustrates the impact of
the number of contours and layer thickness. The volumetric error can be minimized
with a higher raster angle and lower layer thickness. Figure 3d depicts the influence
of orientation and raster angle upon volumetric error; and it is found that volumetric
error will be minimum with an increase in raster and increase in orientation. Figure 3e
depicts the impact of orientation and the number of contours, which shows that the
volumetric error will be minimum when orientation is between 15° and 30°, and the
number of contours should be one. Figure 3f shows the impact of raster angle and
number of contours on the volumetric error, which shows that with a lower value
of raster angle and lower value of the number of contours, the volumetric error will
177
Fig. 2 Comparison between the CAD model made by SolidWorks and CAD model obtained from
the scanner
3 Results and Discussion
It is observed that when an actual part is manufactured from the CAD model in the
FDM machine, the total volume of the part gets affected due to shrinkage and may
be due to the generation of stress, which results in a change in volume of the built
part. The CAD model made by SolidWorks software is having a volume equals to
15357.30 mm
3 . By using a 3D scanner, the actual part is scanned, and its volume is
found out. Finally, the percentage error of volume is determined for each reading,
as shown in Table 2, and it was observed that the percentage error is within 10%
adequacy of the developed FDM parts.
To know the statistical adequacy and significance of process parameters, analysis
of variance (ANOVA) (Table 3) of volumetric error has been performed [12, 14].
The coefficient of determination (R
2 ) of 96.04% suggests the statistical validity of
the model. Table 3 indicates that A, B, C, A 2 , B 2 , A × B, C × D are the major process
parameters.
To govern the impact of process parameters on volumetric error, three-dimensional
surface plot analysis is carried out (Fig. 3). The three-dimensional surface plot
between the best substantial variable interactions for volumetric change is shown
in Fig. 3. It may be perceived from Fig. 3a that volumetric change can be minimized
by decreasing the layer thickness to 0.127 mm and decreasing the orientation to 0°.
Figure 3b shows the effect of layer thickness and raster angle; it may be witnessed
from the figure that minimum volumetric error will be obtained when the raster
angle increases and decrease in layer thickness. Figure 3c illustrates the impact of
the number of contours and layer thickness. The volumetric error can be minimized
with a higher raster angle and lower layer thickness. Figure 3d depicts the influence
of orientation and raster angle upon volumetric error; and it is found that volumetric
error will be minimum with an increase in raster and increase in orientation. Figure 3e
depicts the impact of orientation and the number of contours, which shows that the
volumetric error will be minimum when orientation is between 15° and 30°, and the
number of contours should be one. Figure 3f shows the impact of raster angle and
number of contours on the volumetric error, which shows that with a lower value
of raster angle and lower value of the number of contours, the volumetric error will