

176
M. V. Mansaram et al.
2.2 Methods
In a traditional experiment procedure, fixing one factor and varying the other factors
takes time, and also, visualization of the interaction of various factors becomes difficult. This results in several experimentations for getting optimum parameter settings
and finally obtaining a conclusion. To eliminate such problems, the DOE approach
has been adopted for planning and performing the experiments [12, 13]. DOE is a
powerful medium for investigating the aspects influencing the performance of the
FDM machine. It is found that FDM is a machining process that includes a greater
number of input parameters, which decides the output performance. Hence, in the
present work, RSM is used for deciding the experimental design and investigate the
influence of aforesaid variables in consideration of enhancing dimensional accuracy. It also shows the effect and interaction of various parameters. After deciding
the optimization method, the next is a very important step to select the number of
process parameters and their levels. Initially, large numbers of process parameters
were involved. Among them, significant process variables can be identified from
the literature review. Build orientation, the number of contours, layer thickness, and
raster angle are chosen as influencing variables, and their levels included in the FDM
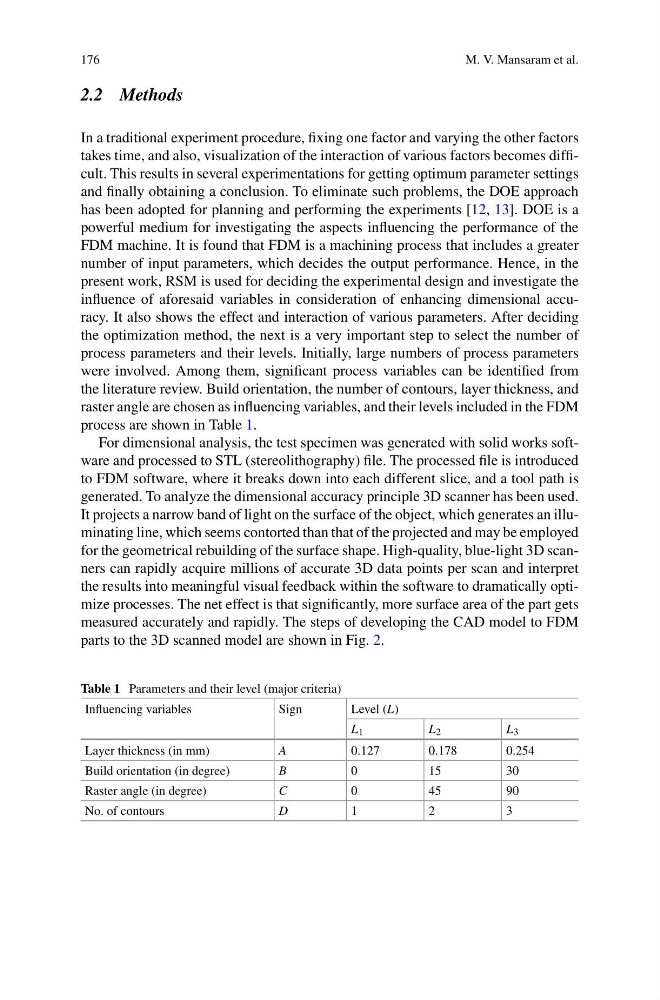
process are shown in Table 1.
For dimensional analysis, the test specimen was generated with solid works software and processed to STL (stereolithography) file. The processed file is introduced
to FDM software, where it breaks down into each different slice, and a tool path is
generated. To analyze the dimensional accuracy principle 3D scanner has been used.
It projects a narrow band of light on the surface of the object, which generates an illuminating line, which seems contorted than that of the projected and may be employed
for the geometrical rebuilding of the surface shape. High-quality, blue-light 3D scanners can rapidly acquire millions of accurate 3D data points per scan and interpret
the results into meaningful visual feedback within the software to dramatically optimize processes. The net effect is that significantly, more surface area of the part gets
measured accurately and rapidly. The steps of developing the CAD model to FDM
parts to the 3D scanned model are shown in Fig. 2.
Table 1 Parameters and their level (major criteria)
Influencing variables
Sign
Level (L)
L 1
L 2
L 3
Layer thickness (in mm)
A
0.127
0.178
0.254
Build orientation (in degree)
B
0
15
30
Raster angle (in degree)
C
0
45
90
No. of contours
D
1
2
3
M. V. Mansaram et al.
2.2 Methods
In a traditional experiment procedure, fixing one factor and varying the other factors
takes time, and also, visualization of the interaction of various factors becomes difficult. This results in several experimentations for getting optimum parameter settings
and finally obtaining a conclusion. To eliminate such problems, the DOE approach
has been adopted for planning and performing the experiments [12, 13]. DOE is a
powerful medium for investigating the aspects influencing the performance of the
FDM machine. It is found that FDM is a machining process that includes a greater
number of input parameters, which decides the output performance. Hence, in the
present work, RSM is used for deciding the experimental design and investigate the
influence of aforesaid variables in consideration of enhancing dimensional accuracy. It also shows the effect and interaction of various parameters. After deciding
the optimization method, the next is a very important step to select the number of
process parameters and their levels. Initially, large numbers of process parameters
were involved. Among them, significant process variables can be identified from
the literature review. Build orientation, the number of contours, layer thickness, and
raster angle are chosen as influencing variables, and their levels included in the FDM
process are shown in Table 1.
For dimensional analysis, the test specimen was generated with solid works software and processed to STL (stereolithography) file. The processed file is introduced
to FDM software, where it breaks down into each different slice, and a tool path is
generated. To analyze the dimensional accuracy principle 3D scanner has been used.
It projects a narrow band of light on the surface of the object, which generates an illuminating line, which seems contorted than that of the projected and may be employed
for the geometrical rebuilding of the surface shape. High-quality, blue-light 3D scanners can rapidly acquire millions of accurate 3D data points per scan and interpret
the results into meaningful visual feedback within the software to dramatically optimize processes. The net effect is that significantly, more surface area of the part gets
measured accurately and rapidly. The steps of developing the CAD model to FDM
parts to the 3D scanned model are shown in Fig. 2.
Table 1 Parameters and their level (major criteria)
Influencing variables
Sign
Level (L)
L 1
L 2
L 3
Layer thickness (in mm)
A
0.127
0.178
0.254
Build orientation (in degree)
B
0
15
30
Raster angle (in degree)
C
0
45
90
No. of contours
D
1
2
3