

85
The Vickers hardness of the 100% B 6 O sample fell within the lower range reported in the literature (34–45 GPa) for this
material [29, 33, 39, 41, 42], which is promising for a material that is only 98% dense. The drop in hardness for loads above
5 N is likely due to the larger indents possibly encountering porous regions below the indented surface.
Due to the large size of each phase in the composite sample, indents could be made separately in each phase in order to
determine their respective hardness values. The B 4 C- dominant phase had the highest hardness, well in agreement with what
has been reported for monolithic B 4 C (25–35 GPa) in the literature [14, 20, 56, 59]. As seen in the SEM micrographs
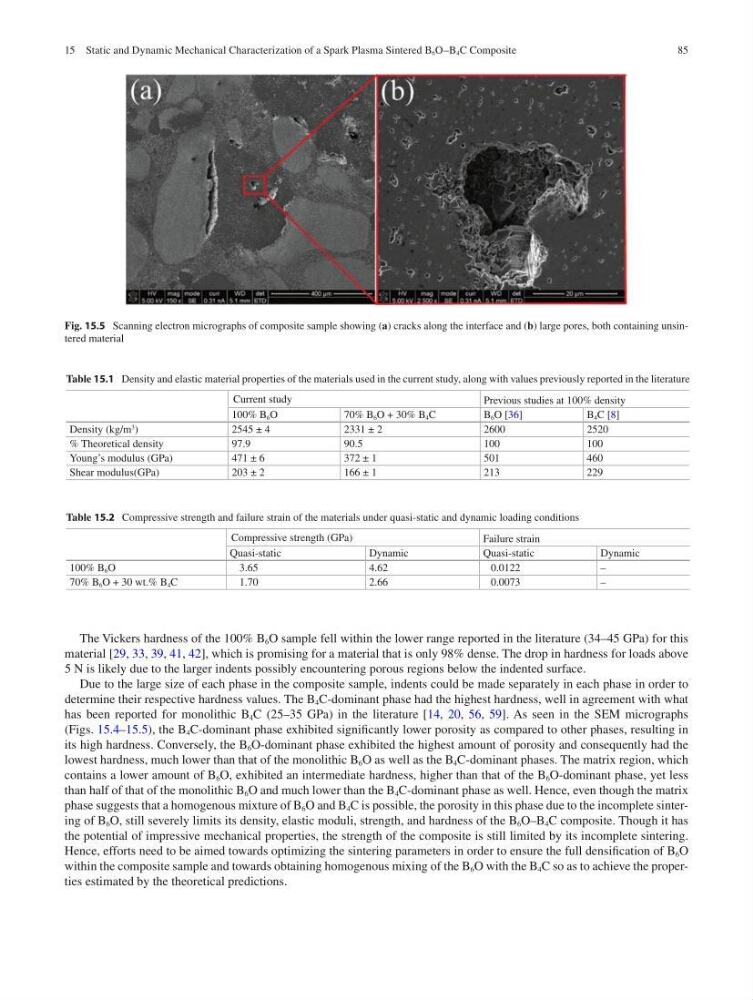
(Figs. 15.4–15.5), the B 4 C-dominant phase exhibited significantly lower porosity as compared to other phases, resulting in
its high hardness. Conversely, the B 6 O-dominant phase exhibited the highest amount of porosity and consequently had the
lowest hardness, much lower than that of the monolithic B 6 O as well as the B 4 C-dominant phases. The matrix region, which
contains a lower amount of B 6 O, exhibited an intermediate hardness, higher than that of the B 6 O- dominant phase, yet less
than half of that of the monolithic B 6 O and much lower than the B 4 C-dominant phase as well. Hence, even though the matrix
phase suggests that a homogenous mixture of B 6 O and B 4 C is possible, the porosity in this phase due to the incomplete sintering of B 6 O, still severely limits its density, elastic moduli, strength, and hardness of the B 6 O–B 4 C composite. Though it has
the potential of impressive mechanical properties, the strength of the composite is still limited by its incomplete sintering.
Hence, efforts need to be aimed towards optimizing the sintering parameters in order to ensure the full densification of B 6 O
within the composite sample and towards obtaining homogenous mixing of the B 6 O with the B 4 C so as to achieve the properties estimated by the theoretical predictions.
Fig. 15.5 Scanning electron micrographs of composite sample showing (a) cracks along the interface and (b) large pores, both containing unsintered material
Table 15.1 Density and elastic material properties of the materials used in the current study, along with values previously reported in the literature
Current study
Previous studies at 100% density
100% B 6 O
70% B 6 O + 30% B 4 C
B 6 O [36]
B 4 C [8]
Density (kg/m
3 )
2545 ± 4
2331 ± 2
2600
2520
% Theoretical density
97.9
90.5
100
100
Young’s modulus (GPa)
471 ± 6
372 ± 1
501
460
Shear modulus(GPa)
203 ± 2
166 ± 1
213
229
Table 15.2 Compressive strength and failure strain of the materials under quasi-static and dynamic loading conditions
Compressive strength (GPa)
Failure strain
Quasi-static
Dynamic
Quasi- static
Dynamic
100% B 6 O
3.65
4.62
0.0122
–
70% B 6 O + 30 wt.% B 4 C
1.70
2.66
0.0073
–
15 Static and Dynamic Mechanical Characterization of a Spark Plasma Sintered B 6 O–B 4 C Composite
The Vickers hardness of the 100% B 6 O sample fell within the lower range reported in the literature (34–45 GPa) for this
material [29, 33, 39, 41, 42], which is promising for a material that is only 98% dense. The drop in hardness for loads above
5 N is likely due to the larger indents possibly encountering porous regions below the indented surface.
Due to the large size of each phase in the composite sample, indents could be made separately in each phase in order to
determine their respective hardness values. The B 4 C- dominant phase had the highest hardness, well in agreement with what
has been reported for monolithic B 4 C (25–35 GPa) in the literature [14, 20, 56, 59]. As seen in the SEM micrographs
(Figs. 15.4–15.5), the B 4 C-dominant phase exhibited significantly lower porosity as compared to other phases, resulting in
its high hardness. Conversely, the B 6 O-dominant phase exhibited the highest amount of porosity and consequently had the
lowest hardness, much lower than that of the monolithic B 6 O as well as the B 4 C-dominant phases. The matrix region, which
contains a lower amount of B 6 O, exhibited an intermediate hardness, higher than that of the B 6 O- dominant phase, yet less
than half of that of the monolithic B 6 O and much lower than the B 4 C-dominant phase as well. Hence, even though the matrix
phase suggests that a homogenous mixture of B 6 O and B 4 C is possible, the porosity in this phase due to the incomplete sintering of B 6 O, still severely limits its density, elastic moduli, strength, and hardness of the B 6 O–B 4 C composite. Though it has
the potential of impressive mechanical properties, the strength of the composite is still limited by its incomplete sintering.
Hence, efforts need to be aimed towards optimizing the sintering parameters in order to ensure the full densification of B 6 O
within the composite sample and towards obtaining homogenous mixing of the B 6 O with the B 4 C so as to achieve the properties estimated by the theoretical predictions.
Fig. 15.5 Scanning electron micrographs of composite sample showing (a) cracks along the interface and (b) large pores, both containing unsintered material
Table 15.1 Density and elastic material properties of the materials used in the current study, along with values previously reported in the literature
Current study
Previous studies at 100% density
100% B 6 O
70% B 6 O + 30% B 4 C
B 6 O [36]
B 4 C [8]
Density (kg/m
3 )
2545 ± 4
2331 ± 2
2600
2520
% Theoretical density
97.9
90.5
100
100
Young’s modulus (GPa)
471 ± 6
372 ± 1
501
460
Shear modulus(GPa)
203 ± 2
166 ± 1
213
229
Table 15.2 Compressive strength and failure strain of the materials under quasi-static and dynamic loading conditions
Compressive strength (GPa)
Failure strain
Quasi-static
Dynamic
Quasi- static
Dynamic
100% B 6 O
3.65
4.62
0.0122
–
70% B 6 O + 30 wt.% B 4 C
1.70
2.66
0.0073
–
15 Static and Dynamic Mechanical Characterization of a Spark Plasma Sintered B 6 O–B 4 C Composite