

40
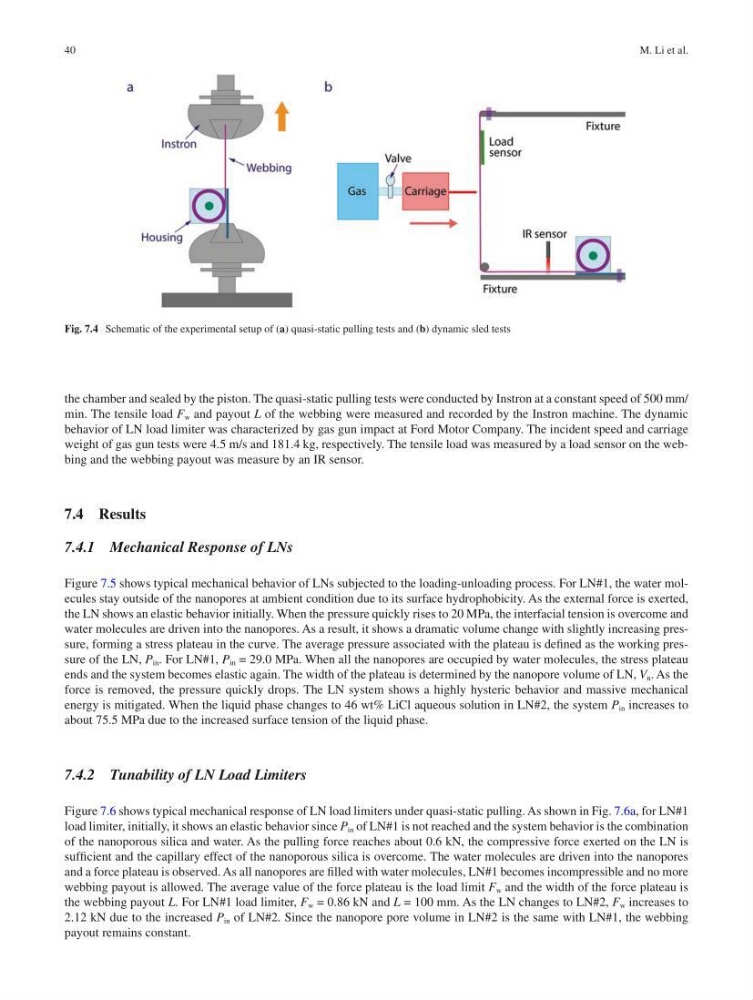
the chamber and sealed by the piston. The quasi-static pulling tests were conducted by Instron at a constant speed of 500 mm/
min. The tensile load F w and payout L of the webbing were measured and recorded by the Instron machine. The dynamic
behavior of LN load limiter was characterized by gas gun impact at Ford Motor Company. The incident speed and carriage
weight of gas gun tests were 4.5 m/s and 181.4 kg, respectively. The tensile load was measured by a load sensor on the webbing and the webbing payout was measure by an IR sensor.
7.4 Results
7.4.1 Mechanical Response of LNs
Figure 7.5 shows typical mechanical behavior of LNs subjected to the loading-unloading process. For LN#1, the water molecules stay outside of the nanopores at ambient condition due to its surface hydrophobicity. As the external force is exerted,
the LN shows an elastic behavior initially. When the pressure quickly rises to 20 MPa, the interfacial tension is overcome and
water molecules are driven into the nanopores. As a result, it shows a dramatic volume change with slightly increasing pressure, forming a stress plateau in the curve. The average pressure associated with the plateau is defined as the working pressure of the LN, P in . For LN#1, P in = 29.0 MPa. When all the nanopores are occupied by water molecules, the stress plateau
ends and the system becomes elastic again. The width of the plateau is determined by the nanopore volume of LN, V n . As the
force is removed, the pressure quickly drops. The LN system shows a highly hysteric behavior and massive mechanical
energy is mitigated. When the liquid phase changes to 46 wt% LiCl aqueous solution in LN#2, the system P in increases to
about 75.5 MPa due to the increased surface tension of the liquid phase.
7.4.2 Tunability of LN Load Limiters
Figure 7.6 shows typical mechanical response of LN load limiters under quasi-static pulling. As shown in Fig. 7.6a, for LN#1
load limiter, initially, it shows an elastic behavior since P in of LN#1 is not reached and the system behavior is the combination
of the nanoporous silica and water. As the pulling force reaches about 0.6 kN, the compressive force exerted on the LN is
sufficient and the capillary effect of the nanoporous silica is overcome. The water molecules are driven into the nanopores
and a force plateau is observed. As all nanopores are filled with water molecules, LN#1 becomes incompressible and no more
webbing payout is allowed. The average value of the force plateau is the load limit F w and the width of the force plateau is
the webbing payout L. For LN#1 load limiter, F w = 0.86 kN and L = 100 mm. As the LN changes to LN#2, F w increases to
2.12 kN due to the increased P in of LN#2. Since the nanopore pore volume in LN#2 is the same with LN#1, the webbing
payout remains constant.
Fig. 7.4 Schematic of the experimental setup of (a) quasi-static pulling tests and (b) dynamic sled tests
M. Li et al.
the chamber and sealed by the piston. The quasi-static pulling tests were conducted by Instron at a constant speed of 500 mm/
min. The tensile load F w and payout L of the webbing were measured and recorded by the Instron machine. The dynamic
behavior of LN load limiter was characterized by gas gun impact at Ford Motor Company. The incident speed and carriage
weight of gas gun tests were 4.5 m/s and 181.4 kg, respectively. The tensile load was measured by a load sensor on the webbing and the webbing payout was measure by an IR sensor.
7.4 Results
7.4.1 Mechanical Response of LNs
Figure 7.5 shows typical mechanical behavior of LNs subjected to the loading-unloading process. For LN#1, the water molecules stay outside of the nanopores at ambient condition due to its surface hydrophobicity. As the external force is exerted,
the LN shows an elastic behavior initially. When the pressure quickly rises to 20 MPa, the interfacial tension is overcome and
water molecules are driven into the nanopores. As a result, it shows a dramatic volume change with slightly increasing pressure, forming a stress plateau in the curve. The average pressure associated with the plateau is defined as the working pressure of the LN, P in . For LN#1, P in = 29.0 MPa. When all the nanopores are occupied by water molecules, the stress plateau
ends and the system becomes elastic again. The width of the plateau is determined by the nanopore volume of LN, V n . As the
force is removed, the pressure quickly drops. The LN system shows a highly hysteric behavior and massive mechanical
energy is mitigated. When the liquid phase changes to 46 wt% LiCl aqueous solution in LN#2, the system P in increases to
about 75.5 MPa due to the increased surface tension of the liquid phase.
7.4.2 Tunability of LN Load Limiters
Figure 7.6 shows typical mechanical response of LN load limiters under quasi-static pulling. As shown in Fig. 7.6a, for LN#1
load limiter, initially, it shows an elastic behavior since P in of LN#1 is not reached and the system behavior is the combination
of the nanoporous silica and water. As the pulling force reaches about 0.6 kN, the compressive force exerted on the LN is
sufficient and the capillary effect of the nanoporous silica is overcome. The water molecules are driven into the nanopores
and a force plateau is observed. As all nanopores are filled with water molecules, LN#1 becomes incompressible and no more
webbing payout is allowed. The average value of the force plateau is the load limit F w and the width of the force plateau is
the webbing payout L. For LN#1 load limiter, F w = 0.86 kN and L = 100 mm. As the LN changes to LN#2, F w increases to
2.12 kN due to the increased P in of LN#2. Since the nanopore pore volume in LN#2 is the same with LN#1, the webbing
payout remains constant.
Fig. 7.4 Schematic of the experimental setup of (a) quasi-static pulling tests and (b) dynamic sled tests
M. Li et al.