

33
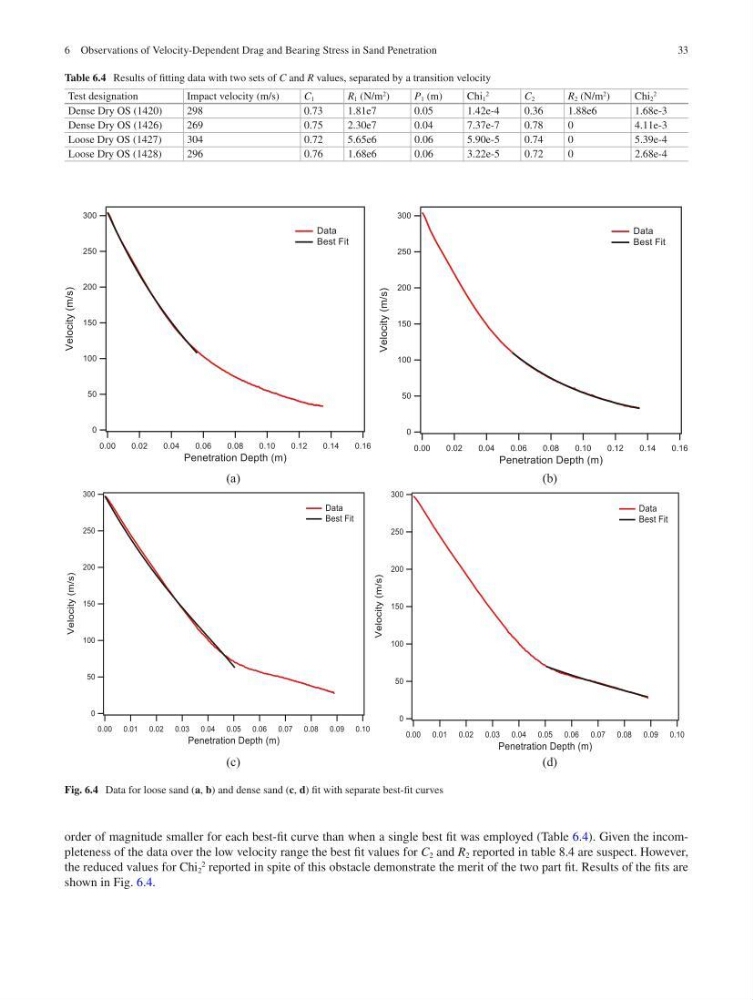
order of magnitude smaller for each best-fit curve than when a single best fit was employed (Table 6.4). Given the incompleteness of the data over the low velocity range the best fit values for C 2 and R 2 reported in table 8.4 are suspect. However,
the reduced values for Chi 2
2
reported in spite of this obstacle demonstrate the merit of the two part fit. Results of the fits are
shown in Fig. 6.4.
(a)
(b)
(c)
(d)
Fig. 6.4 Data for loose sand (a, b) and dense sand (c, d) fit with separate best-fit curves
Table 6.4 Results of fitting data with two sets of C and R values, separated by a transition velocity
Test designation
Impact velocity (m/s)
C 1
R 1 (N/m
2 )
P 1 (m)
Chi 1
2
C 2
R 2 (N/m
2
)
Chi 2
2
Dense Dry OS (1420)
298
0.73
1.81e7
0.05
1.42e-4
0.36
1.88e6
1.68e-3
Dense Dry OS (1426)
269
0.75
2.30e7
0.04
7.37e-7
0.78
0
4.11e-3
Loose Dry OS (1427)
304
0.72
5.65e6
0.06
5.90e-5
0.74
0
5.39e-4
Loose Dry OS (1428)
296
0.76
1.68e6
0.06
3.22e-5
0.72
0
2.68e-4
6 Observations of Velocity-Dependent Drag and Bearing Stress in Sand Penetration
order of magnitude smaller for each best-fit curve than when a single best fit was employed (Table 6.4). Given the incompleteness of the data over the low velocity range the best fit values for C 2 and R 2 reported in table 8.4 are suspect. However,
the reduced values for Chi 2
2
reported in spite of this obstacle demonstrate the merit of the two part fit. Results of the fits are
shown in Fig. 6.4.
(a)
(b)
(c)
(d)
Fig. 6.4 Data for loose sand (a, b) and dense sand (c, d) fit with separate best-fit curves
Table 6.4 Results of fitting data with two sets of C and R values, separated by a transition velocity
Test designation
Impact velocity (m/s)
C 1
R 1 (N/m
2 )
P 1 (m)
Chi 1
2
C 2
R 2 (N/m
2
)
Chi 2
2
Dense Dry OS (1420)
298
0.73
1.81e7
0.05
1.42e-4
0.36
1.88e6
1.68e-3
Dense Dry OS (1426)
269
0.75
2.30e7
0.04
7.37e-7
0.78
0
4.11e-3
Loose Dry OS (1427)
304
0.72
5.65e6
0.06
5.90e-5
0.74
0
5.39e-4
Loose Dry OS (1428)
296
0.76
1.68e6
0.06
3.22e-5
0.72
0
2.68e-4
6 Observations of Velocity-Dependent Drag and Bearing Stress in Sand Penetration