

18
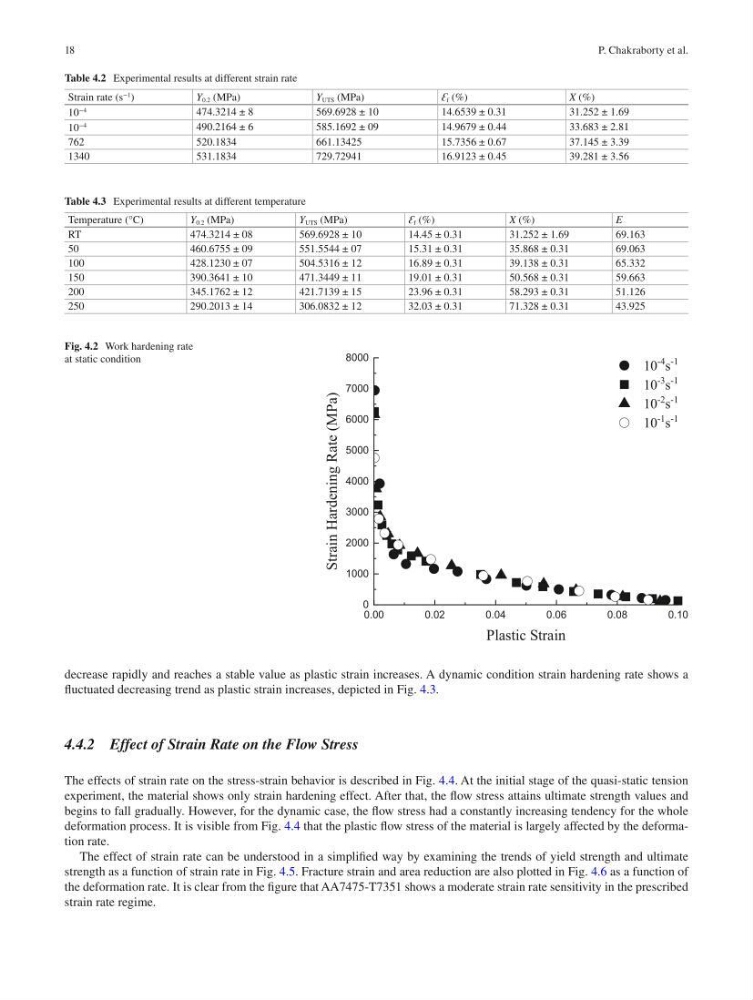
decrease rapidly and reaches a stable value as plastic strain increases. A dynamic condition strain hardening rate shows a
fluctuated decreasing trend as plastic strain increases, depicted in Fig. 4.3.
4.4.2 Effect of Strain Rate on the Flow Stress
The effects of strain rate on the stress-strain behavior is described in Fig. 4.4. At the initial stage of the quasi-static tension
experiment, the material shows only strain hardening effect. After that, the flow stress attains ultimate strength values and
begins to fall gradually. However, for the dynamic case, the flow stress had a constantly increasing tendency for the whole
deformation process. It is visible from Fig. 4.4 that the plastic flow stress of the material is largely affected by the deformation rate.
The effect of strain rate can be understood in a simplified way by examining the trends of yield strength and ultimate
strength as a function of strain rate in Fig. 4.5. Fracture strain and area reduction are also plotted in Fig. 4.6 as a function of
the deformation rate. It is clear from the figure that AA7475-T7351 shows a moderate strain rate sensitivity in the prescribed
strain rate regime.
0.00
0.02
0.04
0.06
0.08
0.10
0
1000
2000
10
-4
s
-1
10
-3
s
-1
10
-2
s
-1
10
-1
s
-1
)
a
P
M
(
e
t
a
R
g
n
i
n
e
d
r
a
H
n
i
a
r
t
S
Plastic Strain
3000
4000
5000
6000
7000
8000
Fig. 4.2 Work hardening rate
at static condition
Table 4.2 Experimental results at different strain rate
Strain rate (s
−1
)
Y 0.2 (MPa)
Y UTS (MPa)
Ɛ f (%)
X (%)
10
−4
474.3214 ± 8
569.6928 ± 10
14.6539 ± 0.31
31.252 ± 1.69
10
−4
490.2164 ± 6
585.1692 ± 09
14.9679 ± 0.44
33.683 ± 2.81
762
520.1834
661.13425
15.7356 ± 0.67
37.145 ± 3.39
1340
531.1834
729.72941
16.9123 ± 0.45
39.281 ± 3.56
Table 4.3 Experimental results at different temperature
Temperature (°C)
Y 0.2 (MPa)
Y UTS (MPa)
Ɛ f (%)
X (%)
E
RT
474.3214 ± 08
569.6928 ± 10
14.45 ± 0.31
31.252 ± 1.69
69.163
50
460.6755 ± 09
551.5544 ± 07
15.31 ± 0.31
35.868 ± 0.31
69.063
100
428.1230 ± 07
504.5316 ± 12
16.89 ± 0.31
39.138 ± 0.31
65.332
150
390.3641 ± 10
471.3449 ± 11
19.01 ± 0.31
50.568 ± 0.31
59.663
200
345.1762 ± 12
421.7139 ± 15
23.96 ± 0.31
58.293 ± 0.31
51.126
250
290.2013 ± 14
306.0832 ± 12
32.03 ± 0.31
71.328 ± 0.31
43.925
P. Chakraborty et al.
decrease rapidly and reaches a stable value as plastic strain increases. A dynamic condition strain hardening rate shows a
fluctuated decreasing trend as plastic strain increases, depicted in Fig. 4.3.
4.4.2 Effect of Strain Rate on the Flow Stress
The effects of strain rate on the stress-strain behavior is described in Fig. 4.4. At the initial stage of the quasi-static tension
experiment, the material shows only strain hardening effect. After that, the flow stress attains ultimate strength values and
begins to fall gradually. However, for the dynamic case, the flow stress had a constantly increasing tendency for the whole
deformation process. It is visible from Fig. 4.4 that the plastic flow stress of the material is largely affected by the deformation rate.
The effect of strain rate can be understood in a simplified way by examining the trends of yield strength and ultimate
strength as a function of strain rate in Fig. 4.5. Fracture strain and area reduction are also plotted in Fig. 4.6 as a function of
the deformation rate. It is clear from the figure that AA7475-T7351 shows a moderate strain rate sensitivity in the prescribed
strain rate regime.
0.00
0.02
0.04
0.06
0.08
0.10
0
1000
2000
10
-4
s
-1
10
-3
s
-1
10
-2
s
-1
10
-1
s
-1
)
a
P
M
(
e
t
a
R
g
n
i
n
e
d
r
a
H
n
i
a
r
t
S
Plastic Strain
3000
4000
5000
6000
7000
8000
Fig. 4.2 Work hardening rate
at static condition
Table 4.2 Experimental results at different strain rate
Strain rate (s
−1
)
Y 0.2 (MPa)
Y UTS (MPa)
Ɛ f (%)
X (%)
10
−4
474.3214 ± 8
569.6928 ± 10
14.6539 ± 0.31
31.252 ± 1.69
10
−4
490.2164 ± 6
585.1692 ± 09
14.9679 ± 0.44
33.683 ± 2.81
762
520.1834
661.13425
15.7356 ± 0.67
37.145 ± 3.39
1340
531.1834
729.72941
16.9123 ± 0.45
39.281 ± 3.56
Table 4.3 Experimental results at different temperature
Temperature (°C)
Y 0.2 (MPa)
Y UTS (MPa)
Ɛ f (%)
X (%)
E
RT
474.3214 ± 08
569.6928 ± 10
14.45 ± 0.31
31.252 ± 1.69
69.163
50
460.6755 ± 09
551.5544 ± 07
15.31 ± 0.31
35.868 ± 0.31
69.063
100
428.1230 ± 07
504.5316 ± 12
16.89 ± 0.31
39.138 ± 0.31
65.332
150
390.3641 ± 10
471.3449 ± 11
19.01 ± 0.31
50.568 ± 0.31
59.663
200
345.1762 ± 12
421.7139 ± 15
23.96 ± 0.31
58.293 ± 0.31
51.126
250
290.2013 ± 14
306.0832 ± 12
32.03 ± 0.31
71.328 ± 0.31
43.925
P. Chakraborty et al.