

17
the one-dimensional wave propagation theory becomes applicable. The specimen stress (σ S ), strain (ε S ), and strain rate
e S
( )
can be evaluated as function of time using the following relations:
s
e
e
e
e
e
S
T
S
R
R
=
( ) ( ) = -
( )
( ) = -
( )
ò
E
A
A
t
t
C
L
t dt
t
C
L
t
T
0
0
0
0
0
2
2
(4.1)
where ε T is the transmitted signal, ε R is the reflected signal, L is the gauge length of the specimen, A is cross-sectional area
of gauge length, A 0 is cross-sectional area of the bar, E 0 is the elastic modulus of the bar, C
E
0
0
0 5
=
æ
è
ç
ö
ø
÷
r
.
is the wave speed in
the bar, ρ is the density of the bar, and t is the time.
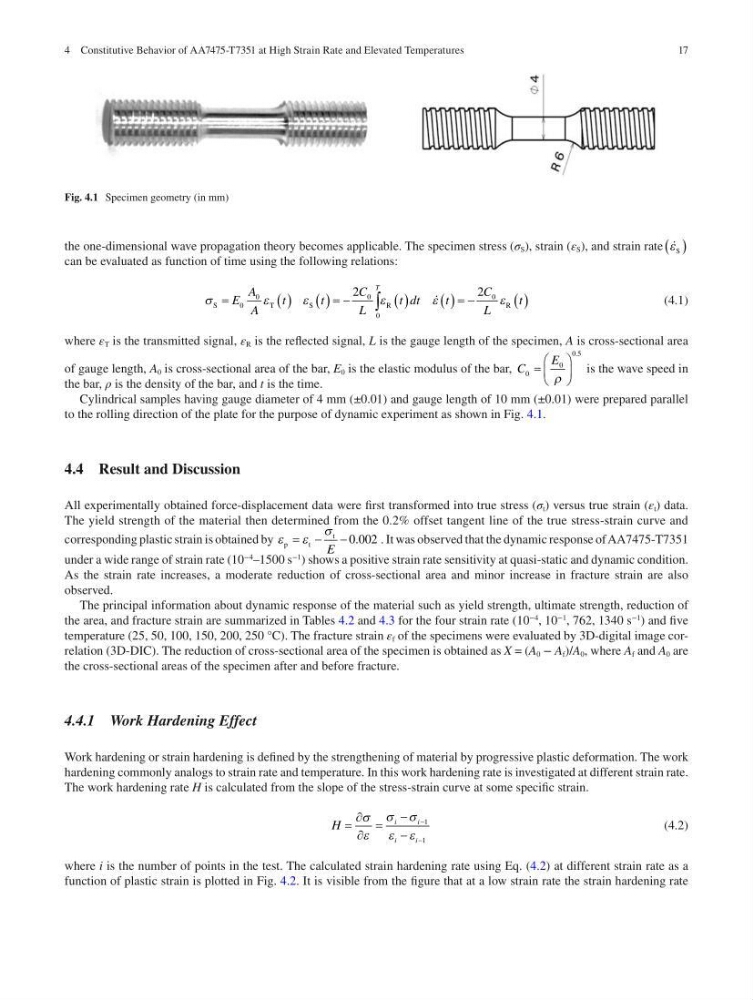
Cylindrical samples having gauge diameter of 4 mm (±0.01) and gauge length of 10 mm (±0.01) were prepared parallel
to the rolling direction of the plate for the purpose of dynamic experiment as shown in Fig. 4.1.
4.4 Result and Discussion
All experimentally obtained force-displacement data were first transformed into true stress (σ t ) versus true strain (ε t ) data.
The yield strength of the material then determined from the 0.2% offset tangent line of the true stress-strain curve and
corresponding plastic strain is obtained by e e
s
p
t
t
= - -
E
0 002
.
. It was observed that the dynamic response of AA7475-T7351
under a wide range of strain rate (10
−4
–1500 s
−1
) shows a positive strain rate sensitivity at quasi-static and dynamic condition.
As the strain rate increases, a moderate reduction of cross-sectional area and minor increase in fracture strain are also
observed.
The principal information about dynamic response of the material such as yield strength, ultimate strength, reduction of
the area, and fracture strain are summarized in Tables 4.2 and 4.3 for the four strain rate (10
−4
, 10
−1
, 762, 1340 s
−1
) and five
temperature (25, 50, 100, 150, 200, 250 °C). The fracture strain ε f of the specimens were evaluated by 3D-digital image correlation (3D-DIC). The reduction of cross- sectional area of the specimen is obtained as X = (A 0 − A f )/A 0 , where A f and A 0 are
the cross-sectional areas of the specimen after and before fracture.
4.4.1 Work Hardening Effect
Work hardening or strain hardening is defined by the strengthening of material by progressive plastic deformation. The work
hardening commonly analogs to strain rate and temperature. In this work hardening rate is investigated at different strain rate.
The work hardening rate H is calculated from the slope of the stress-strain curve at some specific strain.
H
i
i
i
i
=


=
-
-
-
-
s
e
s s
e e
1
1
(4.2)
where i is the number of points in the test. The calculated strain hardening rate using Eq. (4.2) at different strain rate as a
function of plastic strain is plotted in Fig. 4.2. It is visible from the figure that at a low strain rate the strain hardening rate
Fig. 4.1 Specimen geometry (in mm)
4 Constitutive Behavior of AA7475-T7351 at High Strain Rate and Elevated Temperatures
the one-dimensional wave propagation theory becomes applicable. The specimen stress (σ S ), strain (ε S ), and strain rate
e S
( )
can be evaluated as function of time using the following relations:
s
e
e
e
e
e
S
T
S
R
R
=
( ) ( ) = -
( )
( ) = -
( )
ò
E
A
A
t
t
C
L
t dt
t
C
L
t
T
0
0
0
0
0
2
2
(4.1)
where ε T is the transmitted signal, ε R is the reflected signal, L is the gauge length of the specimen, A is cross-sectional area
of gauge length, A 0 is cross-sectional area of the bar, E 0 is the elastic modulus of the bar, C
E
0
0
0 5
=
æ
è
ç
ö
ø
÷
r
.
is the wave speed in
the bar, ρ is the density of the bar, and t is the time.
Cylindrical samples having gauge diameter of 4 mm (±0.01) and gauge length of 10 mm (±0.01) were prepared parallel
to the rolling direction of the plate for the purpose of dynamic experiment as shown in Fig. 4.1.
4.4 Result and Discussion
All experimentally obtained force-displacement data were first transformed into true stress (σ t ) versus true strain (ε t ) data.
The yield strength of the material then determined from the 0.2% offset tangent line of the true stress-strain curve and
corresponding plastic strain is obtained by e e
s
p
t
t
= - -
E
0 002
.
. It was observed that the dynamic response of AA7475-T7351
under a wide range of strain rate (10
−4
–1500 s
−1
) shows a positive strain rate sensitivity at quasi-static and dynamic condition.
As the strain rate increases, a moderate reduction of cross-sectional area and minor increase in fracture strain are also
observed.
The principal information about dynamic response of the material such as yield strength, ultimate strength, reduction of
the area, and fracture strain are summarized in Tables 4.2 and 4.3 for the four strain rate (10
−4
, 10
−1
, 762, 1340 s
−1
) and five
temperature (25, 50, 100, 150, 200, 250 °C). The fracture strain ε f of the specimens were evaluated by 3D-digital image correlation (3D-DIC). The reduction of cross- sectional area of the specimen is obtained as X = (A 0 − A f )/A 0 , where A f and A 0 are
the cross-sectional areas of the specimen after and before fracture.
4.4.1 Work Hardening Effect
Work hardening or strain hardening is defined by the strengthening of material by progressive plastic deformation. The work
hardening commonly analogs to strain rate and temperature. In this work hardening rate is investigated at different strain rate.
The work hardening rate H is calculated from the slope of the stress-strain curve at some specific strain.
H
i
i
i
i
=


=
-
-
-
-
s
e
s s
e e
1
1
(4.2)
where i is the number of points in the test. The calculated strain hardening rate using Eq. (4.2) at different strain rate as a
function of plastic strain is plotted in Fig. 4.2. It is visible from the figure that at a low strain rate the strain hardening rate
Fig. 4.1 Specimen geometry (in mm)
4 Constitutive Behavior of AA7475-T7351 at High Strain Rate and Elevated Temperatures