

6.2 L-Joints
103
the same machine using the same parameters as the L-joint bending tests. (Table 27).
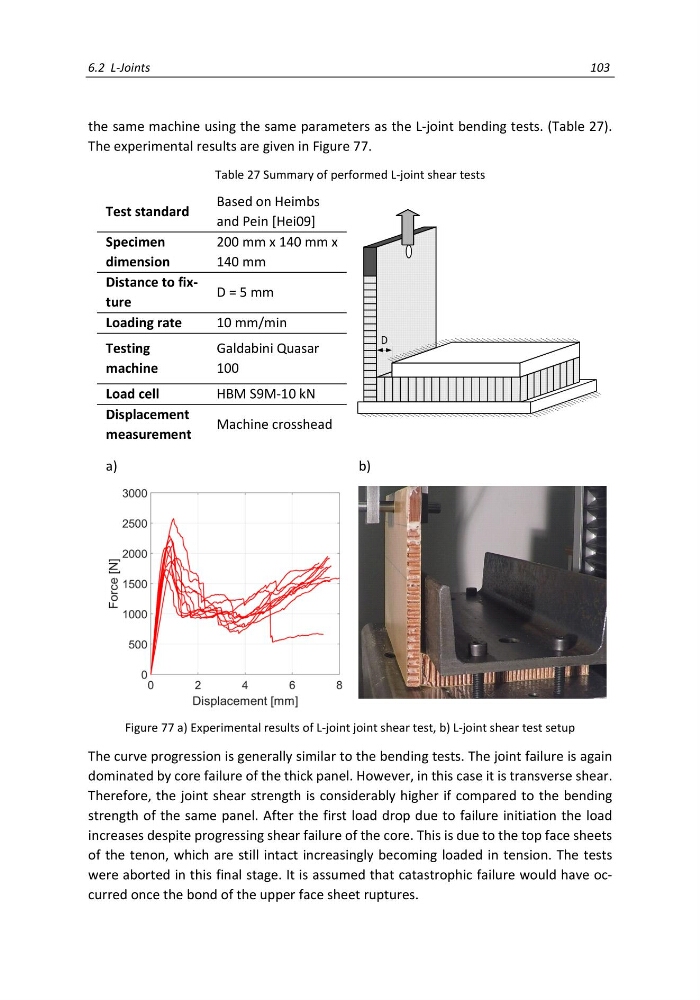
The experimental results are given in Figure 77.
Table 27 Summary of performed L-joint shear tests
Test standard
Based on Heimbs
and Pein [Hei09]
Specimen
dimension
200 mm x 140 mm x
140 mm
Distance to fixture
D = 5 mm
Loading rate
10 mm/min
Testing
machine
Galdabini Quasar
100
Load cell
HBM S9M-10 kN
Displacement
measurement
Machine crosshead
a)
b)
Figure 77 a) Experimental results of L-joint joint shear test, b) L-joint shear test setup
The curve progression is generally similar to the bending tests. The joint failure is again
dominated by core failure of the thick panel. However, in this case it is transverse shear.
Therefore, the joint shear strength is considerably higher if compared to the bending
strength of the same panel. After the first load drop due to failure initiation the load
increases despite progressing shear failure of the core. This is due to the top face sheets
of the tenon, which are still intact increasingly becoming loaded in tension. The tests
were aborted in this final stage. It is assumed that catastrophic failure would have occurred once the bond of the upper face sheet ruptures.
103
the same machine using the same parameters as the L-joint bending tests. (Table 27).
The experimental results are given in Figure 77.
Table 27 Summary of performed L-joint shear tests
Test standard
Based on Heimbs
and Pein [Hei09]
Specimen
dimension
200 mm x 140 mm x
140 mm
Distance to fixture
D = 5 mm
Loading rate
10 mm/min
Testing
machine
Galdabini Quasar
100
Load cell
HBM S9M-10 kN
Displacement
measurement
Machine crosshead
a)
b)
Figure 77 a) Experimental results of L-joint joint shear test, b) L-joint shear test setup
The curve progression is generally similar to the bending tests. The joint failure is again
dominated by core failure of the thick panel. However, in this case it is transverse shear.
Therefore, the joint shear strength is considerably higher if compared to the bending
strength of the same panel. After the first load drop due to failure initiation the load
increases despite progressing shear failure of the core. This is due to the top face sheets
of the tenon, which are still intact increasingly becoming loaded in tension. The tests
were aborted in this final stage. It is assumed that catastrophic failure would have occurred once the bond of the upper face sheet ruptures.