

8.6 Neural Development
465
(G θ = 0.2) is specified in two regions of the inner layer a distance d apart, and
longitudinal contraction (G z = 0.2) is specified within a relatively distant region of
length d; the rest of the tube remains passive.
This contractile pattern creates two outward bulges by the following mechanisms. Local circumferential contraction shortens the circumference of the tube,
constricting the wall to form a “vesicle” on the left, while longitudinal contraction
bends the wall outward to create a “rhombomere” on the right. Although both
bulging regions have the same initial length, longitudinal contraction causes the
rhombomere to become considerably shorter than the vesicle (Fig. 8.51), consistent
with observations (Fig. 8.50, HH11).
We now consider in more detail the 3D model of Garcia et al. (2017), which
is used to simulate morphogenesis of the midbrain and forebrain (without optic
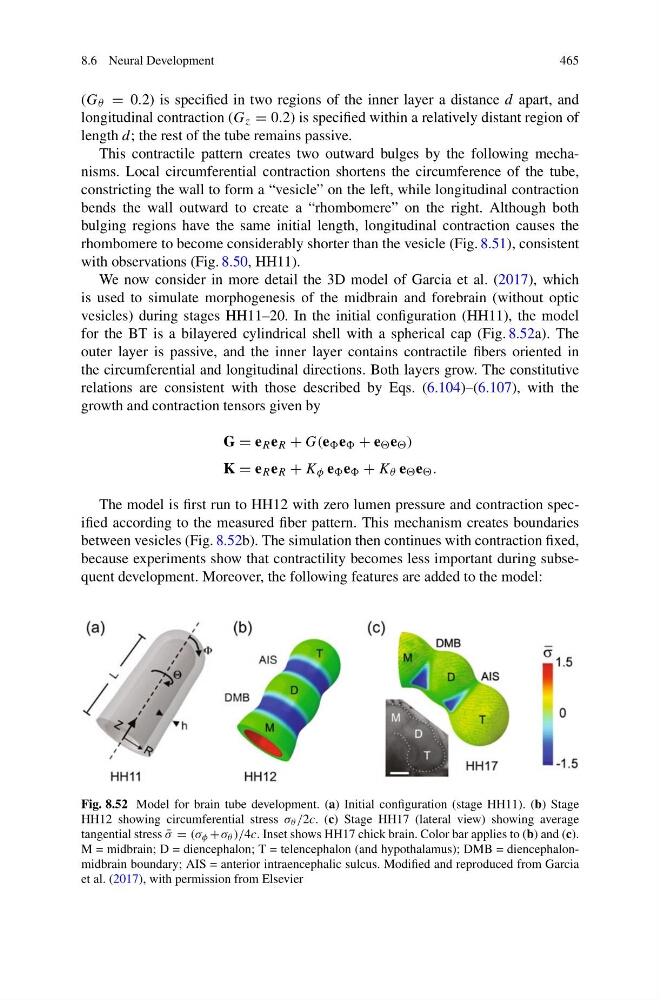
vesicles) during stages HH11–20. In the initial configuration (HH11), the model
for the BT is a bilayered cylindrical shell with a spherical cap (Fig. 8.52a). The
outer layer is passive, and the inner layer contains contractile fibers oriented in
the circumferential and longitudinal directions. Both layers grow. The constitutive
relations are consistent with those described by Eqs. (6.104)–(6.107), with the
growth and contraction tensors given by
G = e R e R + G(e e + e e )
K = e R e R + K φ e e + K θ e e .
The model is first run to HH12 with zero lumen pressure and contraction specified according to the measured fiber pattern. This mechanism creates boundaries
between vesicles (Fig. 8.52b). The simulation then continues with contraction fixed,
because experiments show that contractility becomes less important during subsequent development. Moreover, the following features are added to the model:
Fig. 8.52 Model for brain tube development. (a) Initial configuration (stage HH11). (b) Stage
HH12 showing circumferential stress σ θ /2c. (c) Stage HH17 (lateral view) showing average
tangential stress ¯
σ = (σ φ +σ θ )/4c. Inset shows HH17 chick brain. Color bar applies to (b) and (c).
M = midbrain; D = diencephalon; T = telencephalon (and hypothalamus); DMB = diencephalonmidbrain boundary; AIS = anterior intraencephalic sulcus. Modified and reproduced from Garcia
et al. (2017), with permission from Elsevier
465
(G θ = 0.2) is specified in two regions of the inner layer a distance d apart, and
longitudinal contraction (G z = 0.2) is specified within a relatively distant region of
length d; the rest of the tube remains passive.
This contractile pattern creates two outward bulges by the following mechanisms. Local circumferential contraction shortens the circumference of the tube,
constricting the wall to form a “vesicle” on the left, while longitudinal contraction
bends the wall outward to create a “rhombomere” on the right. Although both
bulging regions have the same initial length, longitudinal contraction causes the
rhombomere to become considerably shorter than the vesicle (Fig. 8.51), consistent
with observations (Fig. 8.50, HH11).
We now consider in more detail the 3D model of Garcia et al. (2017), which
is used to simulate morphogenesis of the midbrain and forebrain (without optic
vesicles) during stages HH11–20. In the initial configuration (HH11), the model
for the BT is a bilayered cylindrical shell with a spherical cap (Fig. 8.52a). The
outer layer is passive, and the inner layer contains contractile fibers oriented in
the circumferential and longitudinal directions. Both layers grow. The constitutive
relations are consistent with those described by Eqs. (6.104)–(6.107), with the
growth and contraction tensors given by
G = e R e R + G(e e + e e )
K = e R e R + K φ e e + K θ e e .
The model is first run to HH12 with zero lumen pressure and contraction specified according to the measured fiber pattern. This mechanism creates boundaries
between vesicles (Fig. 8.52b). The simulation then continues with contraction fixed,
because experiments show that contractility becomes less important during subsequent development. Moreover, the following features are added to the model:
Fig. 8.52 Model for brain tube development. (a) Initial configuration (stage HH11). (b) Stage
HH12 showing circumferential stress σ θ /2c. (c) Stage HH17 (lateral view) showing average
tangential stress ¯
σ = (σ φ +σ θ )/4c. Inset shows HH17 chick brain. Color bar applies to (b) and (c).
M = midbrain; D = diencephalon; T = telencephalon (and hypothalamus); DMB = diencephalonmidbrain boundary; AIS = anterior intraencephalic sulcus. Modified and reproduced from Garcia
et al. (2017), with permission from Elsevier