

442
8 Morphogenesis
symmetry
plane
NP
anterior
posterior
cell wedging
convergent
extension
X
Y
Z
epidermal
shaping
G < 1
NP border
blastoderm
VM
G > 1
1 / G
G < 1
G > 1
N
T
Z
N
T
Z
dorsal
ventral
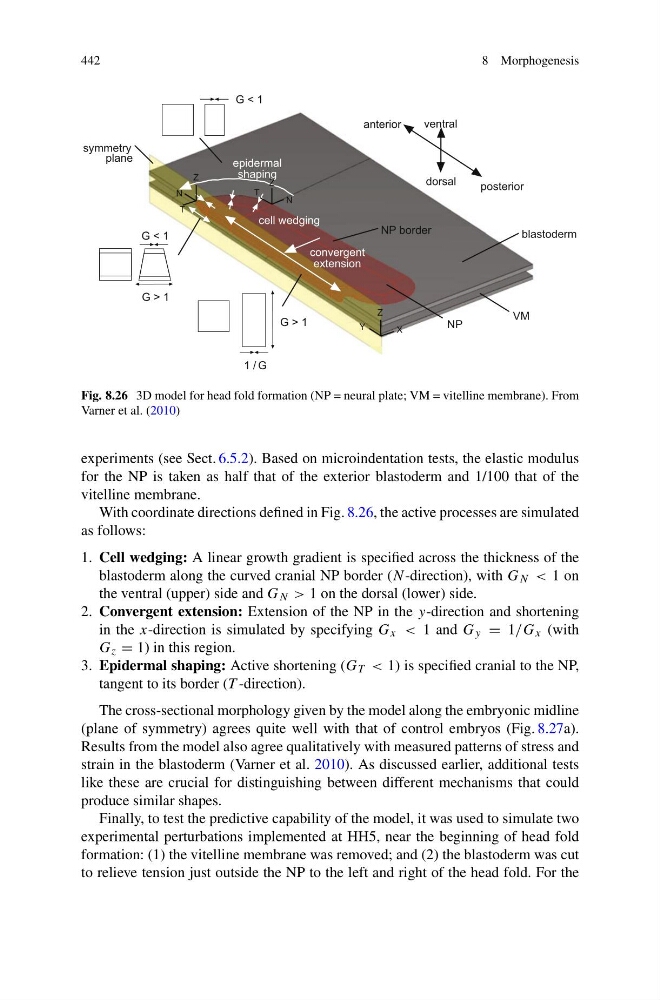
Fig. 8.26 3D model for head fold formation (NP = neural plate; VM = vitelline membrane). From
Varner et al. (2010)
experiments (see Sect. 6.5.2). Based on microindentation tests, the elastic modulus
for the NP is taken as half that of the exterior blastoderm and 1/100 that of the
vitelline membrane.
With coordinate directions defined in Fig. 8.26, the active processes are simulated
as follows:
1. Cell wedging: A linear growth gradient is specified across the thickness of the
blastoderm along the curved cranial NP border (N -direction), with G N < 1 on
the ventral (upper) side and G N > 1 on the dorsal (lower) side.
2. Convergent extension: Extension of the NP in the y-direction and shortening
in the x-direction is simulated by specifying G x < 1 and G y = 1/G x (with
G z = 1) in this region.
3. Epidermal shaping: Active shortening (G T < 1) is specified cranial to the NP,
tangent to its border (T -direction).
The cross-sectional morphology given by the model along the embryonic midline
(plane of symmetry) agrees quite well with that of control embryos (Fig. 8.27a).
Results from the model also agree qualitatively with measured patterns of stress and
strain in the blastoderm (Varner et al. 2010). As discussed earlier, additional tests
like these are crucial for distinguishing between different mechanisms that could
produce similar shapes.
Finally, to test the predictive capability of the model, it was used to simulate two
experimental perturbations implemented at HH5, near the beginning of head fold
formation: (1) the vitelline membrane was removed; and (2) the blastoderm was cut
to relieve tension just outside the NP to the left and right of the head fold. For the
8 Morphogenesis
symmetry
plane
NP
anterior
posterior
cell wedging
convergent
extension
X
Y
Z
epidermal
shaping
G < 1
NP border
blastoderm
VM
G > 1
1 / G
G < 1
G > 1
N
T
Z
N
T
Z
dorsal
ventral
Fig. 8.26 3D model for head fold formation (NP = neural plate; VM = vitelline membrane). From
Varner et al. (2010)
experiments (see Sect. 6.5.2). Based on microindentation tests, the elastic modulus
for the NP is taken as half that of the exterior blastoderm and 1/100 that of the
vitelline membrane.
With coordinate directions defined in Fig. 8.26, the active processes are simulated
as follows:
1. Cell wedging: A linear growth gradient is specified across the thickness of the
blastoderm along the curved cranial NP border (N -direction), with G N < 1 on
the ventral (upper) side and G N > 1 on the dorsal (lower) side.
2. Convergent extension: Extension of the NP in the y-direction and shortening
in the x-direction is simulated by specifying G x < 1 and G y = 1/G x (with
G z = 1) in this region.
3. Epidermal shaping: Active shortening (G T < 1) is specified cranial to the NP,
tangent to its border (T -direction).
The cross-sectional morphology given by the model along the embryonic midline
(plane of symmetry) agrees quite well with that of control embryos (Fig. 8.27a).
Results from the model also agree qualitatively with measured patterns of stress and
strain in the blastoderm (Varner et al. 2010). As discussed earlier, additional tests
like these are crucial for distinguishing between different mechanisms that could
produce similar shapes.
Finally, to test the predictive capability of the model, it was used to simulate two
experimental perturbations implemented at HH5, near the beginning of head fold
formation: (1) the vitelline membrane was removed; and (2) the blastoderm was cut
to relieve tension just outside the NP to the left and right of the head fold. For the