

376
7 Remodeling
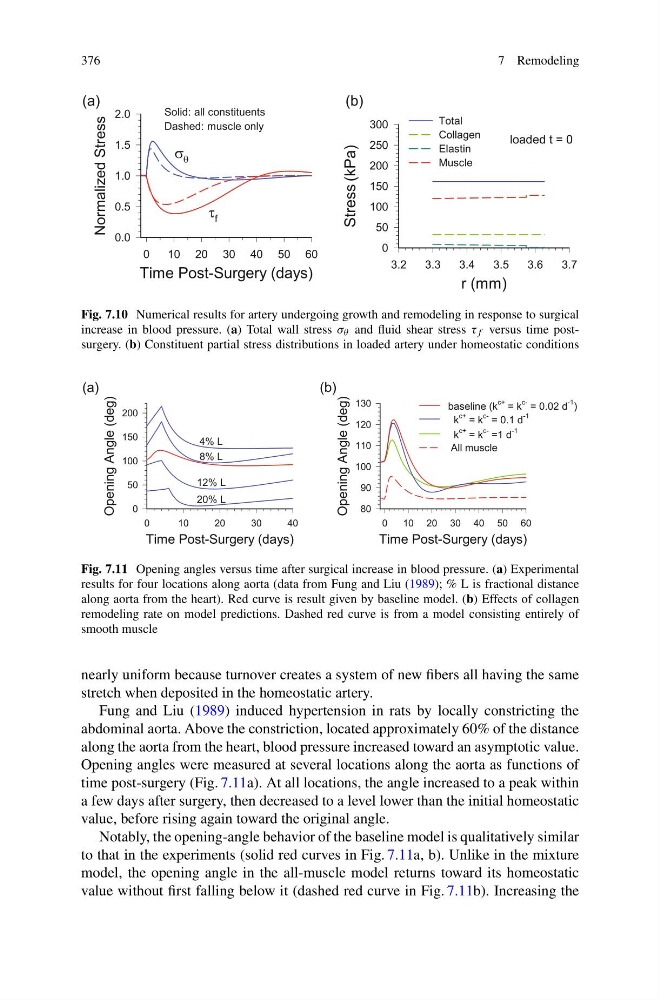
Fig. 7.10 Numerical results for artery undergoing growth and remodeling in response to surgical
increase in blood pressure. (a) Total wall stress σ θ and fluid shear stress τ f versus time postsurgery. (b) Constituent partial stress distributions in loaded artery under homeostatic conditions
Fig. 7.11 Opening angles versus time after surgical increase in blood pressure. (a) Experimental
results for four locations along aorta (data from Fung and Liu (1989); % L is fractional distance
along aorta from the heart). Red curve is result given by baseline model. (b) Effects of collagen
remodeling rate on model predictions. Dashed red curve is from a model consisting entirely of
smooth muscle
nearly uniform because turnover creates a system of new fibers all having the same
stretch when deposited in the homeostatic artery.
Fung and Liu (1989) induced hypertension in rats by locally constricting the
abdominal aorta. Above the constriction, located approximately 60% of the distance
along the aorta from the heart, blood pressure increased toward an asymptotic value.
Opening angles were measured at several locations along the aorta as functions of
time post-surgery (Fig. 7.11a). At all locations, the angle increased to a peak within
a few days after surgery, then decreased to a level lower than the initial homeostatic
value, before rising again toward the original angle.
Notably, the opening-angle behavior of the baseline model is qualitatively similar
to that in the experiments (solid red curves in Fig. 7.11a, b). Unlike in the mixture
model, the opening angle in the all-muscle model returns toward its homeostatic
value without first falling below it (dashed red curve in Fig. 7.11b). Increasing the
7 Remodeling
Fig. 7.10 Numerical results for artery undergoing growth and remodeling in response to surgical
increase in blood pressure. (a) Total wall stress σ θ and fluid shear stress τ f versus time postsurgery. (b) Constituent partial stress distributions in loaded artery under homeostatic conditions
Fig. 7.11 Opening angles versus time after surgical increase in blood pressure. (a) Experimental
results for four locations along aorta (data from Fung and Liu (1989); % L is fractional distance
along aorta from the heart). Red curve is result given by baseline model. (b) Effects of collagen
remodeling rate on model predictions. Dashed red curve is from a model consisting entirely of
smooth muscle
nearly uniform because turnover creates a system of new fibers all having the same
stretch when deposited in the homeostatic artery.
Fung and Liu (1989) induced hypertension in rats by locally constricting the
abdominal aorta. Above the constriction, located approximately 60% of the distance
along the aorta from the heart, blood pressure increased toward an asymptotic value.
Opening angles were measured at several locations along the aorta as functions of
time post-surgery (Fig. 7.11a). At all locations, the angle increased to a peak within
a few days after surgery, then decreased to a level lower than the initial homeostatic
value, before rising again toward the original angle.
Notably, the opening-angle behavior of the baseline model is qualitatively similar
to that in the experiments (solid red curves in Fig. 7.11a, b). Unlike in the mixture
model, the opening angle in the all-muscle model returns toward its homeostatic
value without first falling below it (dashed red curve in Fig. 7.11b). Increasing the