

332
6 Growth
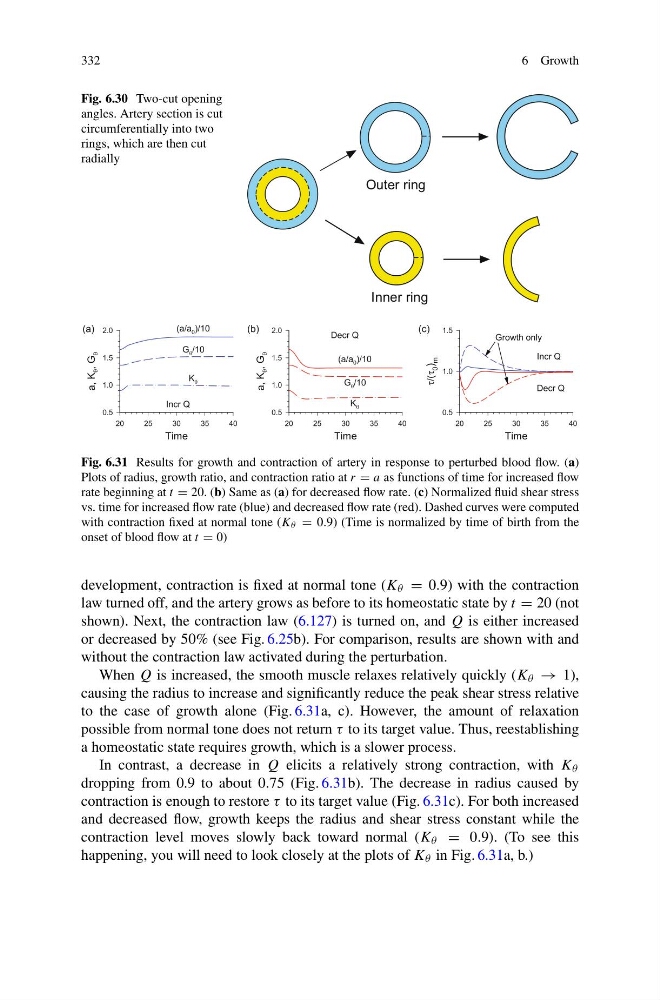
Fig. 6.30 Two-cut opening
angles. Artery section is cut
circumferentially into two
rings, which are then cut
radially
Outer ring
Inner ring
Fig. 6.31 Results for growth and contraction of artery in response to perturbed blood flow. (a)
Plots of radius, growth ratio, and contraction ratio at r = a as functions of time for increased flow
rate beginning at t = 20. (b) Same as (a) for decreased flow rate. (c) Normalized fluid shear stress
vs. time for increased flow rate (blue) and decreased flow rate (red). Dashed curves were computed
with contraction fixed at normal tone (K θ = 0.9) (Time is normalized by time of birth from the
onset of blood flow at t = 0)
development, contraction is fixed at normal tone (K θ = 0.9) with the contraction
law turned off, and the artery grows as before to its homeostatic state by t = 20 (not
shown). Next, the contraction law (6.127) is turned on, and Q is either increased
or decreased by 50% (see Fig. 6.25b). For comparison, results are shown with and
without the contraction law activated during the perturbation.
When Q is increased, the smooth muscle relaxes relatively quickly (K θ → 1),
causing the radius to increase and significantly reduce the peak shear stress relative
to the case of growth alone (Fig. 6.31a, c). However, the amount of relaxation
possible from normal tone does not return τ to its target value. Thus, reestablishing
a homeostatic state requires growth, which is a slower process.
In contrast, a decrease in Q elicits a relatively strong contraction, with K θ
dropping from 0.9 to about 0.75 (Fig. 6.31b). The decrease in radius caused by
contraction is enough to restore τ to its target value (Fig. 6.31c). For both increased
and decreased flow, growth keeps the radius and shear stress constant while the
contraction level moves slowly back toward normal (K θ = 0.9). (To see this
happening, you will need to look closely at the plots of K θ in Fig. 6.31a, b.)
6 Growth
Fig. 6.30 Two-cut opening
angles. Artery section is cut
circumferentially into two
rings, which are then cut
radially
Outer ring
Inner ring
Fig. 6.31 Results for growth and contraction of artery in response to perturbed blood flow. (a)
Plots of radius, growth ratio, and contraction ratio at r = a as functions of time for increased flow
rate beginning at t = 20. (b) Same as (a) for decreased flow rate. (c) Normalized fluid shear stress
vs. time for increased flow rate (blue) and decreased flow rate (red). Dashed curves were computed
with contraction fixed at normal tone (K θ = 0.9) (Time is normalized by time of birth from the
onset of blood flow at t = 0)
development, contraction is fixed at normal tone (K θ = 0.9) with the contraction
law turned off, and the artery grows as before to its homeostatic state by t = 20 (not
shown). Next, the contraction law (6.127) is turned on, and Q is either increased
or decreased by 50% (see Fig. 6.25b). For comparison, results are shown with and
without the contraction law activated during the perturbation.
When Q is increased, the smooth muscle relaxes relatively quickly (K θ → 1),
causing the radius to increase and significantly reduce the peak shear stress relative
to the case of growth alone (Fig. 6.31a, c). However, the amount of relaxation
possible from normal tone does not return τ to its target value. Thus, reestablishing
a homeostatic state requires growth, which is a slower process.
In contrast, a decrease in Q elicits a relatively strong contraction, with K θ
dropping from 0.9 to about 0.75 (Fig. 6.31b). The decrease in radius caused by
contraction is enough to restore τ to its target value (Fig. 6.31c). For both increased
and decreased flow, growth keeps the radius and shear stress constant while the
contraction level moves slowly back toward normal (K θ = 0.9). (To see this
happening, you will need to look closely at the plots of K θ in Fig. 6.31a, b.)