

500000- (LiTFSI)/LAGP–PEO1/LiMFP cell at 50
C (at 0.1
C, 0.2
C, 0.5
C, and
1.0
C). Even at a high rate (1.0
C), the discharge capacity was 115 mAh g
À1 .
Figure 8.11e shows the CV, which confirms the reversible process of Li
+ extraction
and insertion. The oxidation peaks at 3.6 and 4.23 V (attributed to Fe
2+ to Fe
3+ and
Mn
2+ to Mn
3+ ), and the reduction peaks at 3.5 and 3.96 V (attributed to the reduction
of Fe
3+ to Fe
2+ and Mn
3+ to Mn
2+ ) agree well with the chargeÀdischarge plateaus as
shown in Fig. 8.11c.
Arya et al. (Arya and Sharma 2017c) investigated the effect of various nanofillers
(BaTiO 3 , CeO 2, Er 2 O 3 , TiO 2 ) on the PEO–PVC blend polymer electrolyte. The
XRD analysis confirms the polymer nanocomposite formation. FTIR provides
evidence of interaction among the functional groups of the polymer with the ions
and the nanofiller in terms of shifting and change of the peak profile. The highest
ionic conductivity is 2.3 Â 10
À5 S cm
À1 with a wide electrochemical stability
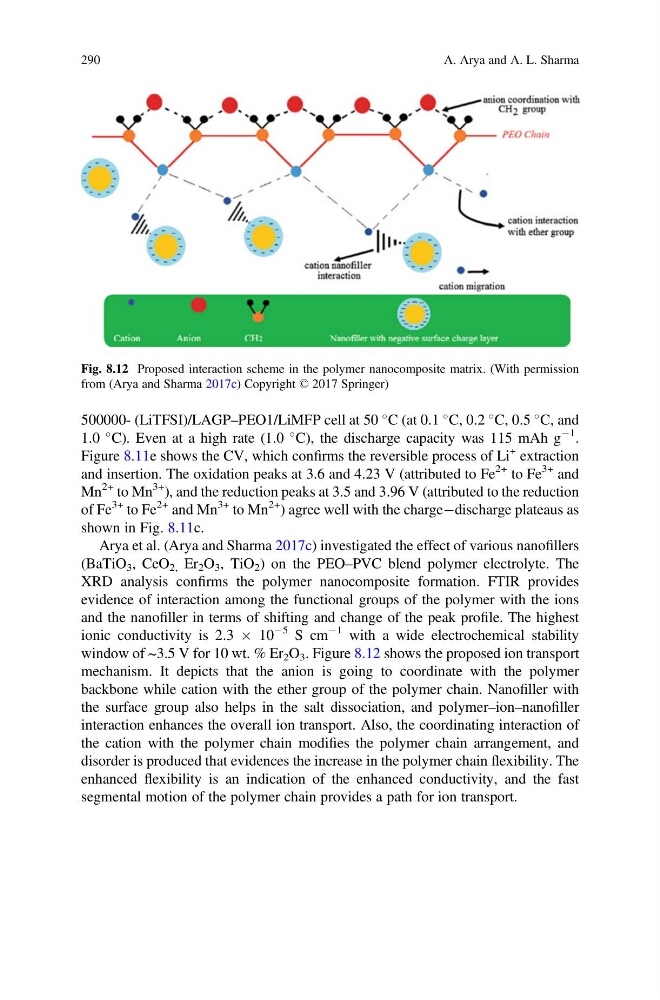
window of ~3.5 V for 10 wt. % Er 2 O 3 . Figure 8.12 shows the proposed ion transport
mechanism. It depicts that the anion is going to coordinate with the polymer
backbone while cation with the ether group of the polymer chain. Nanofiller with
the surface group also helps in the salt dissociation, and polymer–ion–nanofiller
interaction enhances the overall ion transport. Also, the coordinating interaction of
the cation with the polymer chain modifies the polymer chain arrangement, and
disorder is produced that evidences the increase in the polymer chain flexibility. The
enhanced flexibility is an indication of the enhanced conductivity, and the fast
segmental motion of the polymer chain provides a path for ion transport.
Fig. 8.12 Proposed interaction scheme in the polymer nanocomposite matrix. (With permission
from (Arya and Sharma 2017c) Copyright © 2017 Springer)
290
A. Arya and A. L. Sharma
C (at 0.1
C, 0.2
C, 0.5
C, and
1.0
C). Even at a high rate (1.0
C), the discharge capacity was 115 mAh g
À1 .
Figure 8.11e shows the CV, which confirms the reversible process of Li
+ extraction
and insertion. The oxidation peaks at 3.6 and 4.23 V (attributed to Fe
2+ to Fe
3+ and
Mn
2+ to Mn
3+ ), and the reduction peaks at 3.5 and 3.96 V (attributed to the reduction
of Fe
3+ to Fe
2+ and Mn
3+ to Mn
2+ ) agree well with the chargeÀdischarge plateaus as
shown in Fig. 8.11c.
Arya et al. (Arya and Sharma 2017c) investigated the effect of various nanofillers
(BaTiO 3 , CeO 2, Er 2 O 3 , TiO 2 ) on the PEO–PVC blend polymer electrolyte. The
XRD analysis confirms the polymer nanocomposite formation. FTIR provides
evidence of interaction among the functional groups of the polymer with the ions
and the nanofiller in terms of shifting and change of the peak profile. The highest
ionic conductivity is 2.3 Â 10
À5 S cm
À1 with a wide electrochemical stability
window of ~3.5 V for 10 wt. % Er 2 O 3 . Figure 8.12 shows the proposed ion transport
mechanism. It depicts that the anion is going to coordinate with the polymer
backbone while cation with the ether group of the polymer chain. Nanofiller with
the surface group also helps in the salt dissociation, and polymer–ion–nanofiller
interaction enhances the overall ion transport. Also, the coordinating interaction of
the cation with the polymer chain modifies the polymer chain arrangement, and
disorder is produced that evidences the increase in the polymer chain flexibility. The
enhanced flexibility is an indication of the enhanced conductivity, and the fast
segmental motion of the polymer chain provides a path for ion transport.
Fig. 8.12 Proposed interaction scheme in the polymer nanocomposite matrix. (With permission
from (Arya and Sharma 2017c) Copyright © 2017 Springer)
290
A. Arya and A. L. Sharma