

logic layering and a set of fractures, the mutual
intersections define a penetrative lineation that permeates the rock mass (Fig. 3.4a). To the extent that
both foliations are planar, the intersections define
straight lineations. Attitudes gathered at different
outcrops would be approximately equal and the
resulting points would plot in a very tight cluster
on a stereogram. A possible alternative is that the
lithologic layering is folded and the fractures are
roughly planar (Fig. 3.4b). In this case the intersections define continuous curves in three-dimensional space that permeate the rock mass, so
attitudes from different outcrops would plot at
scattered locations on the stereogram.
An outstanding challenge for structural geologists is the development of procedures to define
individual curves in three-dimensional space
from scattered measurements of the attitudes
and outcrop locations of a penetrative lineation.
The underlying presumption is that the linear
fabric elements from scattered outcrops are part
of a coherent and continuous pattern of curves in
three dimensions, much like the flow lines of a
three-dimensional steady-state flow problem in
fluid mechanics. The flow lines are everywhere
parallel to the local velocity vector. We are not presuming that penetrative lineations have any particular relationship to a velocity field. Rather we
are advocating the study of such lineations in a
three-dimensional spatial context that could lead
to their quantitative characterization using differential geometry. With such a characterization
in hand one could model the structures using continuum mechanics and test hypotheses concerning relationships between the fabric and the
velocity field.
3.1.2 Parametric representation of
curves
Given the intuitive concept that a curve is a set of
points, arranged “side by side” in some orderly
and continuous distribution, it should not be surprising that position vectors, which define the
locations of points, are used to define curves. To
distinguish individual points clearly from the set
of points composing a curve we use the symbol p
for the position vector of a point and c for the
curve. The spatial continuity of the set of points
composing a curve is achieved by defining c as a
continuous function. Because c is a vector quantity these functions are called vector functions.
Curves in three-dimensional Euclidean space are
3.1 THE CONCEPT AND DESCRIPTION OF LINEATIONS
79
(a)
(b)
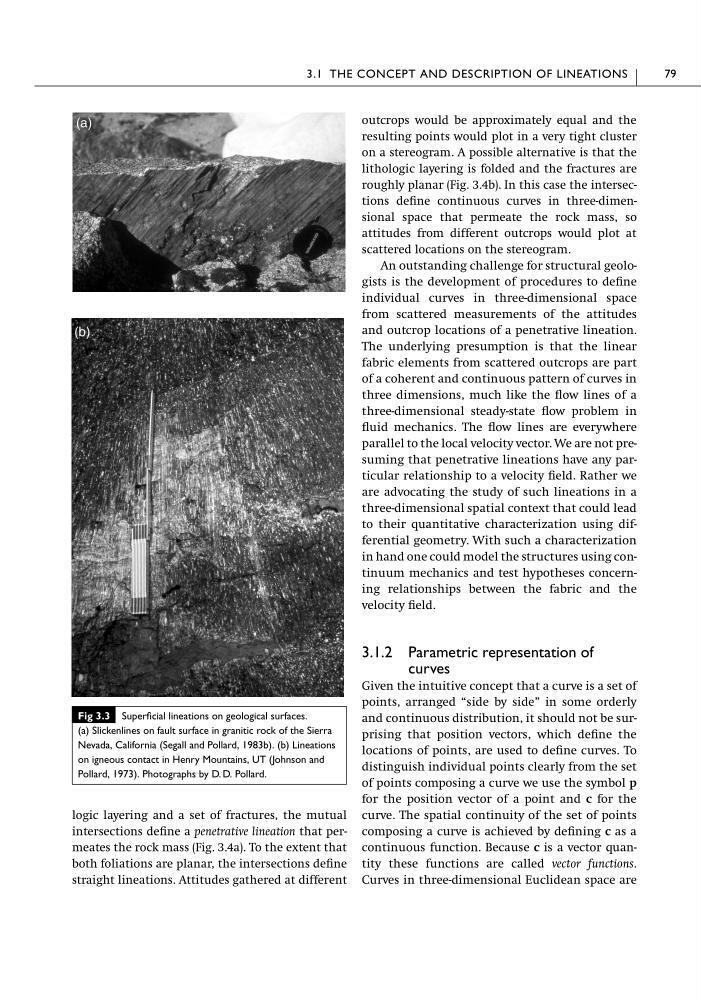
Fig 3.3 Superficial lineations on geological surfaces.
(a) Slickenlines on fault surface in granitic rock of the Sierra
Nevada, California (Segall and Pollard, 1983b). (b) Lineations
on igneous contact in Henry Mountains, UT (Johnson and
Pollard, 1973). Photographs by D. D. Pollard.
intersections define a penetrative lineation that permeates the rock mass (Fig. 3.4a). To the extent that
both foliations are planar, the intersections define
straight lineations. Attitudes gathered at different
outcrops would be approximately equal and the
resulting points would plot in a very tight cluster
on a stereogram. A possible alternative is that the
lithologic layering is folded and the fractures are
roughly planar (Fig. 3.4b). In this case the intersections define continuous curves in three-dimensional space that permeate the rock mass, so
attitudes from different outcrops would plot at
scattered locations on the stereogram.
An outstanding challenge for structural geologists is the development of procedures to define
individual curves in three-dimensional space
from scattered measurements of the attitudes
and outcrop locations of a penetrative lineation.
The underlying presumption is that the linear
fabric elements from scattered outcrops are part
of a coherent and continuous pattern of curves in
three dimensions, much like the flow lines of a
three-dimensional steady-state flow problem in
fluid mechanics. The flow lines are everywhere
parallel to the local velocity vector. We are not presuming that penetrative lineations have any particular relationship to a velocity field. Rather we
are advocating the study of such lineations in a
three-dimensional spatial context that could lead
to their quantitative characterization using differential geometry. With such a characterization
in hand one could model the structures using continuum mechanics and test hypotheses concerning relationships between the fabric and the
velocity field.
3.1.2 Parametric representation of
curves
Given the intuitive concept that a curve is a set of
points, arranged “side by side” in some orderly
and continuous distribution, it should not be surprising that position vectors, which define the
locations of points, are used to define curves. To
distinguish individual points clearly from the set
of points composing a curve we use the symbol p
for the position vector of a point and c for the
curve. The spatial continuity of the set of points
composing a curve is achieved by defining c as a
continuous function. Because c is a vector quantity these functions are called vector functions.
Curves in three-dimensional Euclidean space are
3.1 THE CONCEPT AND DESCRIPTION OF LINEATIONS
79
(a)
(b)
Fig 3.3 Superficial lineations on geological surfaces.
(a) Slickenlines on fault surface in granitic rock of the Sierra
Nevada, California (Segall and Pollard, 1983b). (b) Lineations
on igneous contact in Henry Mountains, UT (Johnson and
Pollard, 1973). Photographs by D. D. Pollard.