

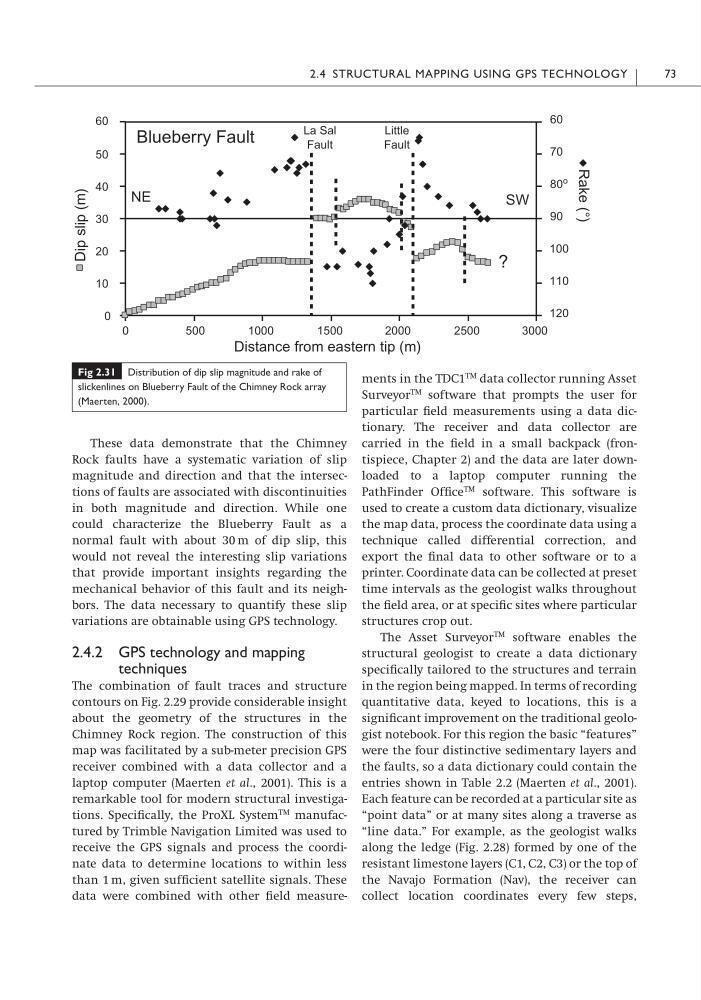
These data demonstrate that the Chimney
Rock faults have a systematic variation of slip
magnitude and direction and that the intersections of faults are associated with discontinuities
in both magnitude and direction. While one
could characterize the Blueberry Fault as a
normal fault with about 30 m of dip slip, this
would not reveal the interesting slip variations
that provide important insights regarding the
mechanical behavior of this fault and its neighbors. The data necessary to quantify these slip
variations are obtainable using GPS technology.
2.4.2 GPS technology and mapping
techniques
The combination of fault traces and structure
contours on Fig. 2.29 provide considerable insight
about the geometry of the structures in the
Chimney Rock region. The construction of this
map was facilitated by a sub-meter precision GPS
receiver combined with a data collector and a
laptop computer (Maerten et al., 2001). This is a
remarkable tool for modern structural investigations. Specifically, the ProXL System
TM manufactured by Trimble Navigation Limited was used to
receive the GPS signals and process the coordinate data to determine locations to within less
than 1 m, given sufficient satellite signals. These
data were combined with other field measurements in the TDC1
TM data collector running Asset
Surveyor
TM software that prompts the user for
particular field measurements using a data dictionary. The receiver and data collector are
carried in the field in a small backpack (frontispiece, Chapter 2) and the data are later downloaded to a laptop computer running the
PathFinder Office
TM software. This software is
used to create a custom data dictionary, visualize
the map data, process the coordinate data using a
technique called differential correction, and
export the final data to other software or to a
printer. Coordinate data can be collected at preset
time intervals as the geologist walks throughout
the field area, or at specific sites where particular
structures crop out.
The Asset Surveyor
TM software enables the
structural geologist to create a data dictionary
specifically tailored to the structures and terrain
in the region being mapped. In terms of recording
quantitative data, keyed to locations, this is a
significant improvement on the traditional geologist notebook. For this region the basic “features”
were the four distinctive sedimentary layers and
the faults, so a data dictionary could contain the
entries shown in Table 2.2 (Maerten et al., 2001).
Each feature can be recorded at a particular site as
“point data” or at many sites along a traverse as
“line data.” For example, as the geologist walks
along the ledge (Fig. 2.28) formed by one of the
resistant limestone layers (C1, C2, C3) or the top of
the Navajo Formation (Nav), the receiver can
collect location coordinates every few steps,
2.4 STRUCTURAL MAPPING USING GPS TECHNOLOGY
73
Fig 2.31 Distribution of dip slip magnitude and rake of
slickenlines on Blueberry Fault of the Chimney Rock array
(Maerten, 2000).
Blueberry Fault
0
500
1000
1500
2000
2500
3000
La Sal
Fault
Little
Fault
NE
SW
?
120
110
100
90
80 o
70
60
Rake (°)
0
10
20
30
40
50
Dip slip (m)
60
Distance from eastern tip (m)
Rock faults have a systematic variation of slip
magnitude and direction and that the intersections of faults are associated with discontinuities
in both magnitude and direction. While one
could characterize the Blueberry Fault as a
normal fault with about 30 m of dip slip, this
would not reveal the interesting slip variations
that provide important insights regarding the
mechanical behavior of this fault and its neighbors. The data necessary to quantify these slip
variations are obtainable using GPS technology.
2.4.2 GPS technology and mapping
techniques
The combination of fault traces and structure
contours on Fig. 2.29 provide considerable insight
about the geometry of the structures in the
Chimney Rock region. The construction of this
map was facilitated by a sub-meter precision GPS
receiver combined with a data collector and a
laptop computer (Maerten et al., 2001). This is a
remarkable tool for modern structural investigations. Specifically, the ProXL System
TM manufactured by Trimble Navigation Limited was used to
receive the GPS signals and process the coordinate data to determine locations to within less
than 1 m, given sufficient satellite signals. These
data were combined with other field measurements in the TDC1
TM data collector running Asset
Surveyor
TM software that prompts the user for
particular field measurements using a data dictionary. The receiver and data collector are
carried in the field in a small backpack (frontispiece, Chapter 2) and the data are later downloaded to a laptop computer running the
PathFinder Office
TM software. This software is
used to create a custom data dictionary, visualize
the map data, process the coordinate data using a
technique called differential correction, and
export the final data to other software or to a
printer. Coordinate data can be collected at preset
time intervals as the geologist walks throughout
the field area, or at specific sites where particular
structures crop out.
The Asset Surveyor
TM software enables the
structural geologist to create a data dictionary
specifically tailored to the structures and terrain
in the region being mapped. In terms of recording
quantitative data, keyed to locations, this is a
significant improvement on the traditional geologist notebook. For this region the basic “features”
were the four distinctive sedimentary layers and
the faults, so a data dictionary could contain the
entries shown in Table 2.2 (Maerten et al., 2001).
Each feature can be recorded at a particular site as
“point data” or at many sites along a traverse as
“line data.” For example, as the geologist walks
along the ledge (Fig. 2.28) formed by one of the
resistant limestone layers (C1, C2, C3) or the top of
the Navajo Formation (Nav), the receiver can
collect location coordinates every few steps,
2.4 STRUCTURAL MAPPING USING GPS TECHNOLOGY
73
Fig 2.31 Distribution of dip slip magnitude and rake of
slickenlines on Blueberry Fault of the Chimney Rock array
(Maerten, 2000).
Blueberry Fault
0
500
1000
1500
2000
2500
3000
La Sal
Fault
Little
Fault
NE
SW
?
120
110
100
90
80 o
70
60
Rake (°)
0
10
20
30
40
50
Dip slip (m)
60
Distance from eastern tip (m)