

strike at the intersection of the 1670 contour and
the 4 344 000 m northing grid line is due north
(Fig. 2.29). The map symbol for strike and dip of
bedding (Fig. 2.16) is placed at this intersection
and recorded as (000, 03). One can judge from the
spacings and orientations of the structure contours that this is a typical strike and dip, at least
over the eastern portion of the map. If the bluegray limestone were planar, the contours would
be straight lines and uniformly spaced. The undulations in these lines suggest that this limestone
layer is locally folded, perhaps as a result of the
faulting or the development of the San Rafael
Swell (Fig. 2.27).
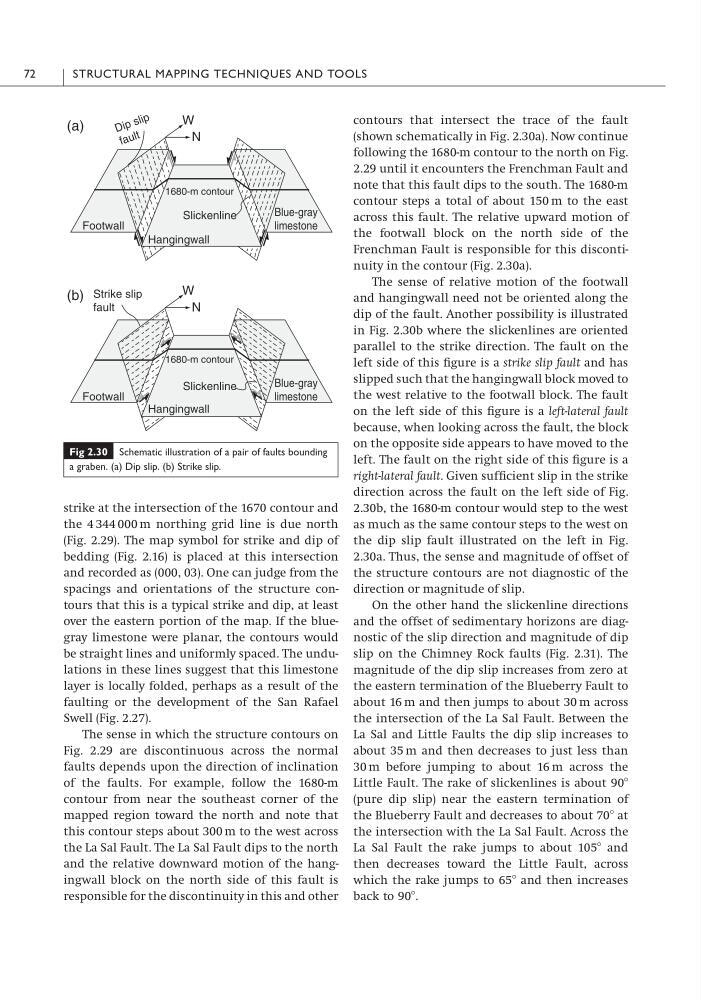
The sense in which the structure contours on
Fig. 2.29 are discontinuous across the normal
faults depends upon the direction of inclination
of the faults. For example, follow the 1680-m
contour from near the southeast corner of the
mapped region toward the north and note that
this contour steps about 300 m to the west across
the La Sal Fault. The La Sal Fault dips to the north
and the relative downward motion of the hangingwall block on the north side of this fault is
responsible for the discontinuity in this and other
contours that intersect the trace of the fault
(shown schematically in Fig. 2.30a). Now continue
following the 1680-m contour to the north on Fig.
2.29 until it encounters the Frenchman Fault and
note that this fault dips to the south. The 1680-m
contour steps a total of about 150 m to the east
across this fault. The relative upward motion of
the footwall block on the north side of the
Frenchman Fault is responsible for this discontinuity in the contour (Fig. 2.30a).
The sense of relative motion of the footwall
and hangingwall need not be oriented along the
dip of the fault. Another possibility is illustrated
in Fig. 2.30b where the slickenlines are oriented
parallel to the strike direction. The fault on the
left side of this figure is a strike slip fault and has
slipped such that the hangingwall block moved to
the west relative to the footwall block. The fault
on the left side of this figure is a left-lateral fault
because, when looking across the fault, the block
on the opposite side appears to have moved to the
left. The fault on the right side of this figure is a
right-lateral fault. Given sufficient slip in the strike
direction across the fault on the left side of Fig.
2.30b, the 1680-m contour would step to the west
as much as the same contour steps to the west on
the dip slip fault illustrated on the left in Fig.
2.30a. Thus, the sense and magnitude of offset of
the structure contours are not diagnostic of the
direction or magnitude of slip.
On the other hand the slickenline directions
and the offset of sedimentary horizons are diagnostic of the slip direction and magnitude of dip
slip on the Chimney Rock faults (Fig. 2.31). The
magnitude of the dip slip increases from zero at
the eastern termination of the Blueberry Fault to
about 16 m and then jumps to about 30 m across
the intersection of the La Sal Fault. Between the
La Sal and Little Faults the dip slip increases to
about 35 m and then decreases to just less than
30 m before jumping to about 16 m across the
Little Fault. The rake of slickenlines is about 90Њ
(pure dip slip) near the eastern termination of
the Blueberry Fault and decreases to about 70Њ at
the intersection with the La Sal Fault. Across the
La Sal Fault the rake jumps to about 105Њ and
then decreases toward the Little Fault, across
which the rake jumps to 65Њ and then increases
back to 90Њ.
72
STRUCTURAL MAPPING TECHNIQUES AND TOOLS
Fig 2.30 Schematic illustration of a pair of faults bounding
a graben. (a) Dip slip. (b) Strike slip.
N
W
N
W
(b)
(a)
Slickenline
Slickenline
1680-m contour
1680-m contour
Hangingwall
Hangingwall
D ip s li p
fa u lt
Footwall
Footwall
Blue-gray
limestone
Blue-gray
limestone
Strike slip
fault
the 4 344 000 m northing grid line is due north
(Fig. 2.29). The map symbol for strike and dip of
bedding (Fig. 2.16) is placed at this intersection
and recorded as (000, 03). One can judge from the
spacings and orientations of the structure contours that this is a typical strike and dip, at least
over the eastern portion of the map. If the bluegray limestone were planar, the contours would
be straight lines and uniformly spaced. The undulations in these lines suggest that this limestone
layer is locally folded, perhaps as a result of the
faulting or the development of the San Rafael
Swell (Fig. 2.27).
The sense in which the structure contours on
Fig. 2.29 are discontinuous across the normal
faults depends upon the direction of inclination
of the faults. For example, follow the 1680-m
contour from near the southeast corner of the
mapped region toward the north and note that
this contour steps about 300 m to the west across
the La Sal Fault. The La Sal Fault dips to the north
and the relative downward motion of the hangingwall block on the north side of this fault is
responsible for the discontinuity in this and other
contours that intersect the trace of the fault
(shown schematically in Fig. 2.30a). Now continue
following the 1680-m contour to the north on Fig.
2.29 until it encounters the Frenchman Fault and
note that this fault dips to the south. The 1680-m
contour steps a total of about 150 m to the east
across this fault. The relative upward motion of
the footwall block on the north side of the
Frenchman Fault is responsible for this discontinuity in the contour (Fig. 2.30a).
The sense of relative motion of the footwall
and hangingwall need not be oriented along the
dip of the fault. Another possibility is illustrated
in Fig. 2.30b where the slickenlines are oriented
parallel to the strike direction. The fault on the
left side of this figure is a strike slip fault and has
slipped such that the hangingwall block moved to
the west relative to the footwall block. The fault
on the left side of this figure is a left-lateral fault
because, when looking across the fault, the block
on the opposite side appears to have moved to the
left. The fault on the right side of this figure is a
right-lateral fault. Given sufficient slip in the strike
direction across the fault on the left side of Fig.
2.30b, the 1680-m contour would step to the west
as much as the same contour steps to the west on
the dip slip fault illustrated on the left in Fig.
2.30a. Thus, the sense and magnitude of offset of
the structure contours are not diagnostic of the
direction or magnitude of slip.
On the other hand the slickenline directions
and the offset of sedimentary horizons are diagnostic of the slip direction and magnitude of dip
slip on the Chimney Rock faults (Fig. 2.31). The
magnitude of the dip slip increases from zero at
the eastern termination of the Blueberry Fault to
about 16 m and then jumps to about 30 m across
the intersection of the La Sal Fault. Between the
La Sal and Little Faults the dip slip increases to
about 35 m and then decreases to just less than
30 m before jumping to about 16 m across the
Little Fault. The rake of slickenlines is about 90Њ
(pure dip slip) near the eastern termination of
the Blueberry Fault and decreases to about 70Њ at
the intersection with the La Sal Fault. Across the
La Sal Fault the rake jumps to about 105Њ and
then decreases toward the Little Fault, across
which the rake jumps to 65Њ and then increases
back to 90Њ.
72
STRUCTURAL MAPPING TECHNIQUES AND TOOLS
Fig 2.30 Schematic illustration of a pair of faults bounding
a graben. (a) Dip slip. (b) Strike slip.
N
W
N
W
(b)
(a)
Slickenline
Slickenline
1680-m contour
1680-m contour
Hangingwall
Hangingwall
D ip s li p
fa u lt
Footwall
Footwall
Blue-gray
limestone
Blue-gray
limestone
Strike slip
fault