

faults are shown on a map (Fig. 2.29) to trend
predominantly to the northwest or to the northeast. One might suppose that the fault system is
composed of two sets based upon these two strike
directions; however, this view does not take into
consideration the dip of the faults. Some of these
faults dip to the north (solid lines), but others
with a similar strike dip to the south (dotted
lines). Therefore, based on the three-dimensional
orientations of these faults, there are a total of
four different sets (Krantz, 1988).
The traces of the Chimney Rock faults range in
length from a few hundred meters to as much as
5 km, and the offsets of the sedimentary marker
horizons range up to almost 40 m, measured in
the fault plane and down the dip of the fault (Fig.
2.30a). As depicted in this sketch, the block of rock
above the fault, referred to as the hangingwall, has
apparently moved down relative to the block
below the fault, which is referred to as the footwall.
Slickenlines on the fault surfaces (Fig. 2.14b) indicate that the slip was approximately down the dip
of these faults. Therefore they are referred to as
dip slip faults. Furthermore, because the hangingwall moved downward relative to the footwall
these are referred to as normal faults. If the hangingwall moved up relative to the footwall they
would be called reverse faults.
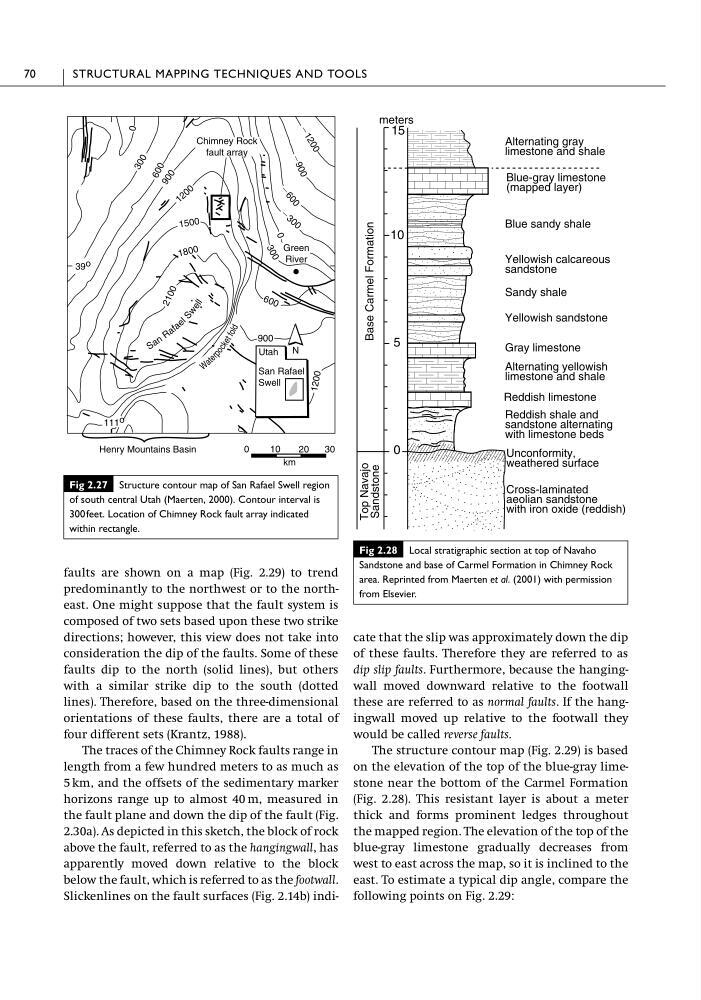
The structure contour map (Fig. 2.29) is based
on the elevation of the top of the blue-gray limestone near the bottom of the Carmel Formation
(Fig. 2.28). This resistant layer is about a meter
thick and forms prominent ledges throughout
the mapped region. The elevation of the top of the
blue-gray limestone gradually decreases from
west to east across the map, so it is inclined to the
east. To estimate a typical dip angle, compare the
following points on Fig. 2.29:
70
STRUCTURAL MAPPING TECHNIQUES AND TOOLS
Fig 2.28 Local stratigraphic section at top of Navaho
Sandstone and base of Carmel Formation in Chimney Rock
area. Reprinted from Maerten et al. (2001) with permission
from Elsevier.
Top Navajo
Sandstone
Base Carmel Formation
Blue-gray limestone
(mapped layer)
Unconformity,
weathered surface
Cross-laminated
aeolian sandstone
with iron oxide (reddish)
0
5
10
meters
15
Reddish shale and
sandstone alternating
with limestone beds
Reddish limestone
Gray limestone
Yellowish calcareous
sandstone
Yellowish sandstone
Sandy shale
Blue sandy shale
Alternating gray
limestone and shale
Alternating yellowish
limestone and shale
Fig 2.27 Structure contour map of San Rafael Swell region
of south central Utah (Maerten, 2000). Contour interval is
300feet. Location of Chimney Rock fault array indicated
within rectangle.
0
10
20
30
km
Utah
San Rafael
Swell
N
Chimney Rock
fault array
Henry Mountains Basin
15 00
18 00
6 0 0
3 0 0
900
12 00
Ϫ 3 0 0
Ϫ 9 0 0 Ϫ 1 2 0 0
0
0
6 0 0
9 0 0
1 2 0 0
3 0 0
2 1 0 0
Ϫ
6 0 0
39 o
111 o
Green
River
S a n R a f a e l
S w e ll
W a t
e r p o c k e t fo ld
predominantly to the northwest or to the northeast. One might suppose that the fault system is
composed of two sets based upon these two strike
directions; however, this view does not take into
consideration the dip of the faults. Some of these
faults dip to the north (solid lines), but others
with a similar strike dip to the south (dotted
lines). Therefore, based on the three-dimensional
orientations of these faults, there are a total of
four different sets (Krantz, 1988).
The traces of the Chimney Rock faults range in
length from a few hundred meters to as much as
5 km, and the offsets of the sedimentary marker
horizons range up to almost 40 m, measured in
the fault plane and down the dip of the fault (Fig.
2.30a). As depicted in this sketch, the block of rock
above the fault, referred to as the hangingwall, has
apparently moved down relative to the block
below the fault, which is referred to as the footwall.
Slickenlines on the fault surfaces (Fig. 2.14b) indicate that the slip was approximately down the dip
of these faults. Therefore they are referred to as
dip slip faults. Furthermore, because the hangingwall moved downward relative to the footwall
these are referred to as normal faults. If the hangingwall moved up relative to the footwall they
would be called reverse faults.
The structure contour map (Fig. 2.29) is based
on the elevation of the top of the blue-gray limestone near the bottom of the Carmel Formation
(Fig. 2.28). This resistant layer is about a meter
thick and forms prominent ledges throughout
the mapped region. The elevation of the top of the
blue-gray limestone gradually decreases from
west to east across the map, so it is inclined to the
east. To estimate a typical dip angle, compare the
following points on Fig. 2.29:
70
STRUCTURAL MAPPING TECHNIQUES AND TOOLS
Fig 2.28 Local stratigraphic section at top of Navaho
Sandstone and base of Carmel Formation in Chimney Rock
area. Reprinted from Maerten et al. (2001) with permission
from Elsevier.
Top Navajo
Sandstone
Base Carmel Formation
Blue-gray limestone
(mapped layer)
Unconformity,
weathered surface
Cross-laminated
aeolian sandstone
with iron oxide (reddish)
0
5
10
meters
15
Reddish shale and
sandstone alternating
with limestone beds
Reddish limestone
Gray limestone
Yellowish calcareous
sandstone
Yellowish sandstone
Sandy shale
Blue sandy shale
Alternating gray
limestone and shale
Alternating yellowish
limestone and shale
Fig 2.27 Structure contour map of San Rafael Swell region
of south central Utah (Maerten, 2000). Contour interval is
300feet. Location of Chimney Rock fault array indicated
within rectangle.
0
10
20
30
km
Utah
San Rafael
Swell
N
Chimney Rock
fault array
Henry Mountains Basin
15 00
18 00
6 0 0
3 0 0
900
12 00
Ϫ 3 0 0
Ϫ 9 0 0 Ϫ 1 2 0 0
0
0
6 0 0
9 0 0
1 2 0 0
3 0 0
2 1 0 0
Ϫ
6 0 0
39 o
111 o
Green
River
S a n R a f a e l
S w e ll
W a t
e r p o c k e t fo ld