

looks very much like the stereonet, but has the
desirable feature that areas bounded by pairs of
adjacent great and small circles, each separated by
the same number of degrees, have the same
surface area (Phillips, 1954). In other words this
net satisfies the cartographic criterion of equivalency, i.e. the correct representation of areas. Note
that such areas clearly are not of equal size on the
stereonet (Fig. 2.21), where pairs of great and small
circles are separated by 10Њ. For example, a 10Њ by
10Њ area near the center of this net is smaller than
one near east or west along the reference circle.
Therefore, a set of points plotted near the center of
the stereonet would appear to be more densely
clustered than a set with the same angular relations plotted near the reference circle.
The need for equivalency is most apparent in
structural studies that address the orientation
statistics of structural elements that define a rock
fabric. Fabric in this context refers to the internal
arrangement of the physical constituents that
make up the rock mass. For example, planar
fabrics in metamorphic rocks (Turner and Weiss,
1963, p. 97) can be composed of layers of different
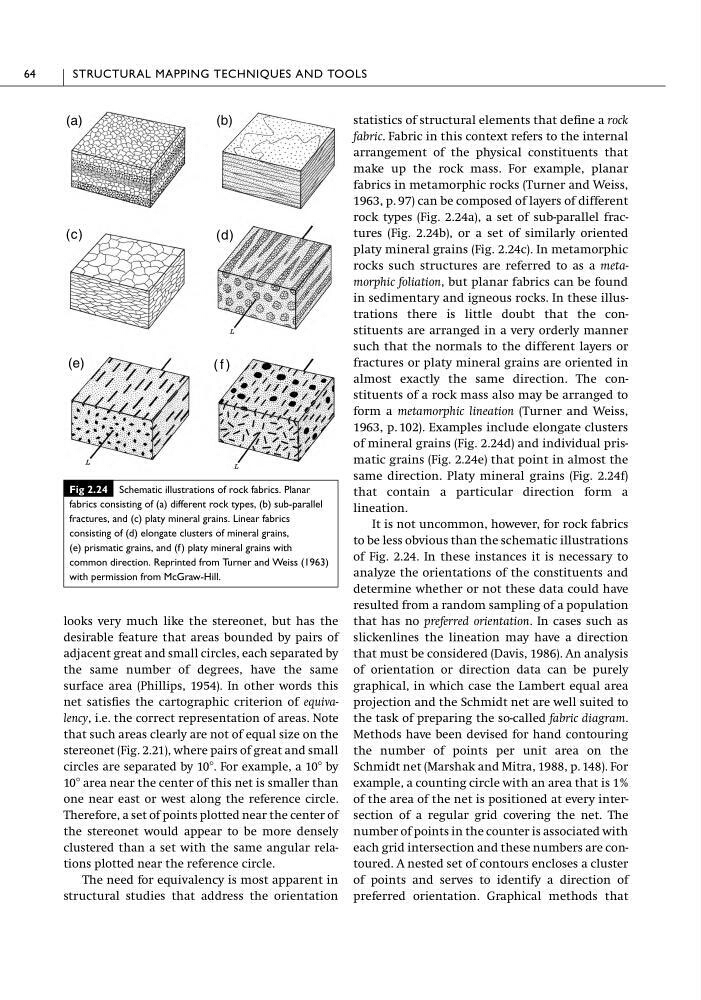
rock types (Fig. 2.24a), a set of sub-parallel fractures (Fig. 2.24b), or a set of similarly oriented
platy mineral grains (Fig. 2.24c). In metamorphic
rocks such structures are referred to as a metamorphic foliation, but planar fabrics can be found
in sedimentary and igneous rocks. In these illustrations there is little doubt that the constituents are arranged in a very orderly manner
such that the normals to the different layers or
fractures or platy mineral grains are oriented in
almost exactly the same direction. The constituents of a rock mass also may be arranged to
form a metamorphic lineation (Turner and Weiss,
1963, p. 102). Examples include elongate clusters
of mineral grains (Fig. 2.24d) and individual prismatic grains (Fig. 2.24e) that point in almost the
same direction. Platy mineral grains (Fig. 2.24f)
that contain a particular direction form a
lineation.
It is not uncommon, however, for rock fabrics
to be less obvious than the schematic illustrations
of Fig. 2.24. In these instances it is necessary to
analyze the orientations of the constituents and
determine whether or not these data could have
resulted from a random sampling of a population
that has no preferred orientation. In cases such as
slickenlines the lineation may have a direction
that must be considered (Davis, 1986). An analysis
of orientation or direction data can be purely
graphical, in which case the Lambert equal area
projection and the Schmidt net are well suited to
the task of preparing the so-called fabric diagram.
Methods have been devised for hand contouring
the number of points per unit area on the
Schmidt net (Marshak and Mitra, 1988, p. 148). For
example, a counting circle with an area that is 1%
of the area of the net is positioned at every intersection of a regular grid covering the net. The
number of points in the counter is associated with
each grid intersection and these numbers are contoured. A nested set of contours encloses a cluster
of points and serves to identify a direction of
preferred orientation. Graphical methods that
64
STRUCTURAL MAPPING TECHNIQUES AND TOOLS
Fig 2.24 Schematic illustrations of rock fabrics. Planar
fabrics consisting of (a) different rock types, (b) sub-parallel
fractures, and (c) platy mineral grains. Linear fabrics
consisting of (d) elongate clusters of mineral grains,
(e) prismatic grains, and (f) platy mineral grains with
common direction. Reprinted from Turner and Weiss (1963)
with permission from McGraw-Hill.
(e)
( f )
(a)
(b)
(c)
(d)
desirable feature that areas bounded by pairs of
adjacent great and small circles, each separated by
the same number of degrees, have the same
surface area (Phillips, 1954). In other words this
net satisfies the cartographic criterion of equivalency, i.e. the correct representation of areas. Note
that such areas clearly are not of equal size on the
stereonet (Fig. 2.21), where pairs of great and small
circles are separated by 10Њ. For example, a 10Њ by
10Њ area near the center of this net is smaller than
one near east or west along the reference circle.
Therefore, a set of points plotted near the center of
the stereonet would appear to be more densely
clustered than a set with the same angular relations plotted near the reference circle.
The need for equivalency is most apparent in
structural studies that address the orientation
statistics of structural elements that define a rock
fabric. Fabric in this context refers to the internal
arrangement of the physical constituents that
make up the rock mass. For example, planar
fabrics in metamorphic rocks (Turner and Weiss,
1963, p. 97) can be composed of layers of different
rock types (Fig. 2.24a), a set of sub-parallel fractures (Fig. 2.24b), or a set of similarly oriented
platy mineral grains (Fig. 2.24c). In metamorphic
rocks such structures are referred to as a metamorphic foliation, but planar fabrics can be found
in sedimentary and igneous rocks. In these illustrations there is little doubt that the constituents are arranged in a very orderly manner
such that the normals to the different layers or
fractures or platy mineral grains are oriented in
almost exactly the same direction. The constituents of a rock mass also may be arranged to
form a metamorphic lineation (Turner and Weiss,
1963, p. 102). Examples include elongate clusters
of mineral grains (Fig. 2.24d) and individual prismatic grains (Fig. 2.24e) that point in almost the
same direction. Platy mineral grains (Fig. 2.24f)
that contain a particular direction form a
lineation.
It is not uncommon, however, for rock fabrics
to be less obvious than the schematic illustrations
of Fig. 2.24. In these instances it is necessary to
analyze the orientations of the constituents and
determine whether or not these data could have
resulted from a random sampling of a population
that has no preferred orientation. In cases such as
slickenlines the lineation may have a direction
that must be considered (Davis, 1986). An analysis
of orientation or direction data can be purely
graphical, in which case the Lambert equal area
projection and the Schmidt net are well suited to
the task of preparing the so-called fabric diagram.
Methods have been devised for hand contouring
the number of points per unit area on the
Schmidt net (Marshak and Mitra, 1988, p. 148). For
example, a counting circle with an area that is 1%
of the area of the net is positioned at every intersection of a regular grid covering the net. The
number of points in the counter is associated with
each grid intersection and these numbers are contoured. A nested set of contours encloses a cluster
of points and serves to identify a direction of
preferred orientation. Graphical methods that
64
STRUCTURAL MAPPING TECHNIQUES AND TOOLS
Fig 2.24 Schematic illustrations of rock fabrics. Planar
fabrics consisting of (a) different rock types, (b) sub-parallel
fractures, and (c) platy mineral grains. Linear fabrics
consisting of (d) elongate clusters of mineral grains,
(e) prismatic grains, and (f) platy mineral grains with
common direction. Reprinted from Turner and Weiss (1963)
with permission from McGraw-Hill.
(e)
( f )
(a)
(b)
(c)
(d)