

et al., 1986). The latter expresses itself as an alternation in dip of the dominant basin-bounding
normal faults.
To model this process, we postulate that in the
brittle crustal layer faulting was initially more distributed, with faults of all length scales giving a
roughly continuous deformation at scales of a few
kilometers or less. Thus, in the initial phase of
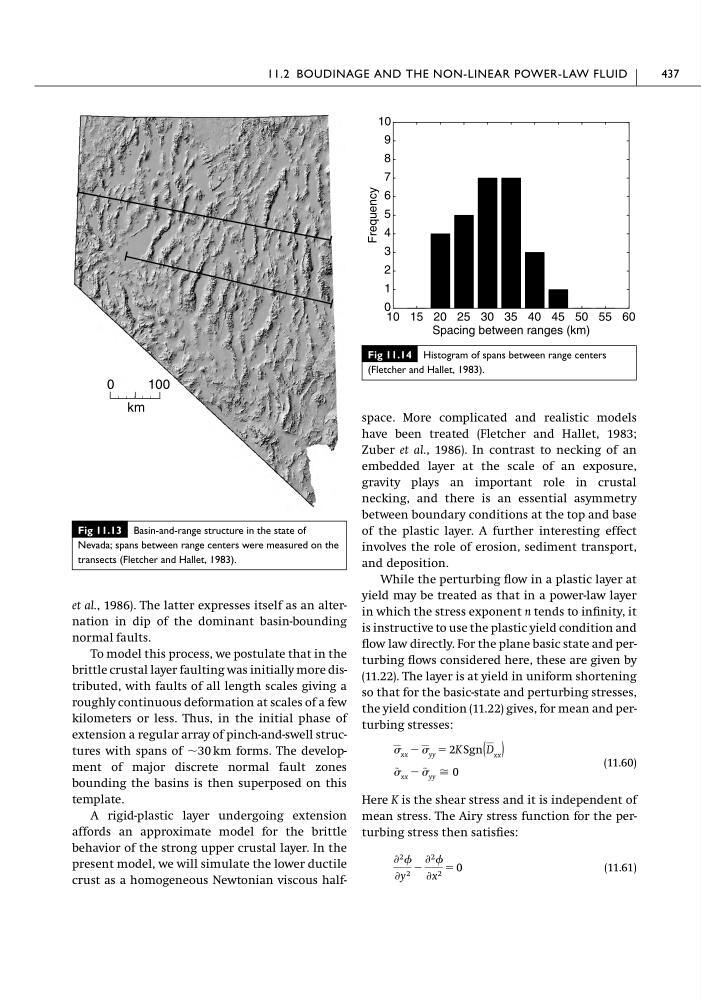
extension a regular array of pinch-and-swell structures with spans of ϳ30 km forms. The development of major discrete normal fault zones
bounding the basins is then superposed on this
template.
A rigid-plastic layer undergoing extension
affords an approximate model for the brittle
behavior of the strong upper crustal layer. In the
present model, we will simulate the lower ductile
crust as a homogeneous Newtonian viscous halfspace. More complicated and realistic models
have been treated (Fletcher and Hallet, 1983;
Zuber et al., 1986). In contrast to necking of an
embedded layer at the scale of an exposure,
gravity plays an important role in crustal
necking, and there is an essential asymmetry
between boundary conditions at the top and base
of the plastic layer. A further interesting effect
involves the role of erosion, sediment transport,
and deposition.
While the perturbing flow in a plastic layer at
yield may be treated as that in a power-law layer
in which the stress exponent n tends to infinity, it
is instructive to use the plastic yield condition and
flow law directly. For the plane basic state and perturbing flows considered here, these are given by
(11.22). The layer is at yield in uniform shortening
so that for the basic-state and perturbing stresses,
the yield condition (11.22) gives, for mean and perturbing stresses:
(11.60)
Here K is the shear stress and it is independent of
mean stress. The Airy stress function for the perturbing stress then satisfies:
(11.61)
Ѩ 2
Ѩy 2 Ϫ
Ѩ 2
Ѩx 2 ϭ 0
~ xx Ϫ ~ yy Х 0
xx Ϫ yy ϭ 2K Sgn(D xx )
11.2 BOUDINAGE AND THE NON-LINEAR POWER-LAW FLUID
437
Fig 11.13 Basin-and-range structure in the state of
Nevada; spans between range centers were measured on the
transects (Fletcher and Hallet, 1983).
0
100
km
Fig 11.14 Histogram of spans between range centers
(Fletcher and Hallet, 1983).
10 15 20 25 30 35 40 45 50 55 60
0
1
2
3
4
5
6
7
8
9
10
Spacing between ranges (km)
Frequency
normal faults.
To model this process, we postulate that in the
brittle crustal layer faulting was initially more distributed, with faults of all length scales giving a
roughly continuous deformation at scales of a few
kilometers or less. Thus, in the initial phase of
extension a regular array of pinch-and-swell structures with spans of ϳ30 km forms. The development of major discrete normal fault zones
bounding the basins is then superposed on this
template.
A rigid-plastic layer undergoing extension
affords an approximate model for the brittle
behavior of the strong upper crustal layer. In the
present model, we will simulate the lower ductile
crust as a homogeneous Newtonian viscous halfspace. More complicated and realistic models
have been treated (Fletcher and Hallet, 1983;
Zuber et al., 1986). In contrast to necking of an
embedded layer at the scale of an exposure,
gravity plays an important role in crustal
necking, and there is an essential asymmetry
between boundary conditions at the top and base
of the plastic layer. A further interesting effect
involves the role of erosion, sediment transport,
and deposition.
While the perturbing flow in a plastic layer at
yield may be treated as that in a power-law layer
in which the stress exponent n tends to infinity, it
is instructive to use the plastic yield condition and
flow law directly. For the plane basic state and perturbing flows considered here, these are given by
(11.22). The layer is at yield in uniform shortening
so that for the basic-state and perturbing stresses,
the yield condition (11.22) gives, for mean and perturbing stresses:
(11.60)
Here K is the shear stress and it is independent of
mean stress. The Airy stress function for the perturbing stress then satisfies:
(11.61)
Ѩ 2
Ѩy 2 Ϫ
Ѩ 2
Ѩx 2 ϭ 0
~ xx Ϫ ~ yy Х 0
xx Ϫ yy ϭ 2K Sgn(D xx )
11.2 BOUDINAGE AND THE NON-LINEAR POWER-LAW FLUID
437
Fig 11.13 Basin-and-range structure in the state of
Nevada; spans between range centers were measured on the
transects (Fletcher and Hallet, 1983).
0
100
km
Fig 11.14 Histogram of spans between range centers
(Fletcher and Hallet, 1983).
10 15 20 25 30 35 40 45 50 55 60
0
1
2
3
4
5
6
7
8
9
10
Spacing between ranges (km)
Frequency