

a modest amount from the actual profile. The pair
of boudins is separated from any other segments
of the same layer by a distance at least comparable
to its length. While part of the deformation is tied
to the normal faulting, including the central neck
between the boudins, the overall form is more
suggestive of a continuous ductile necking.
Detailed study to support or refute this suggestion
has not been carried out by us. None-the-less, this
hypothesis provides a useful example for the
present discussion.
In Fig. 11.11b, we have constructed the rectangles approximating the initial boudin form for
the entire structure, supposing the central neck
to be a later feature, and for the two individual
boudins or pinch-and-swell structures. Their
aspect ratios are, for the entire structure, 4.2, and
for the individuals, 2.3 on the left and 2.7 on the
right. The value for the entire structure is consistent with model values of L d /H for n Ͼ Ͼ 1, but
those for the individual structures are not. It
might be suggested that the latter reflect the tendency for a mechanically isolated segment to
divide in two sub-equal segments if it becomes
unstable with respect to necking, in this case
chiefly by faulting. The present model applies
only to a continuous layer or a segment with very
large aspect ratio, and does not apply directly to
a process involving discrete faults (but see the
next section).
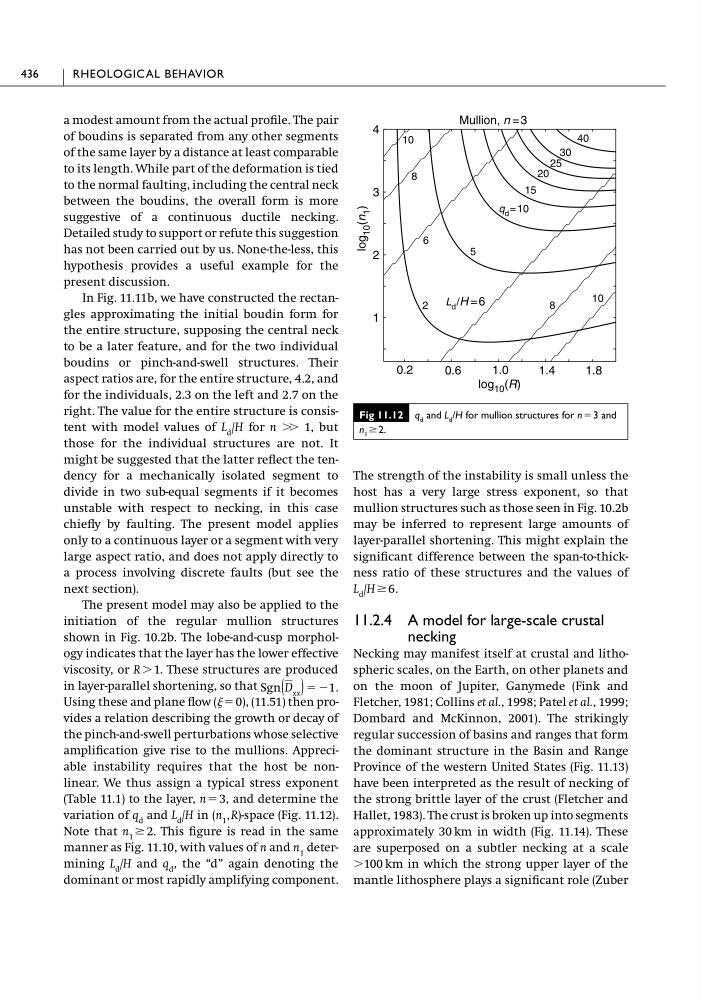
The present model may also be applied to the
initiation of the regular mullion structures
shown in Fig. 10.2b. The lobe-and-cusp morphology indicates that the layer has the lower effective
viscosity, or R Ͼ 1. These structures are produced
in layer-parallel shortening, so that
Using these and plane flow ( ϭ 0), (11.51) then provides a relation describing the growth or decay of
the pinch-and-swell perturbations whose selective
amplification give rise to the mullions. Appreciable instability requires that the host be nonlinear. We thus assign a typical stress exponent
(Table 11.1) to the layer, n ϭ 3, and determine the
variation of q d and L d /H in (n 1 , R)-space (Fig. 11.12).
Note that n 1 Ն 2. This figure is read in the same
manner as Fig. 11.10, with values of n and n 1 determining L d /H and q d , the “d” again denoting the
dominant or most rapidly amplifying component.
Sgn(D xx ) ϭ Ϫ1.
The strength of the instability is small unless the
host has a very large stress exponent, so that
mullion structures such as those seen in Fig. 10.2b
may be inferred to represent large amounts of
layer-parallel shortening. This might explain the
significant difference between the span-to-thickness ratio of these structures and the values of
L d /H Ն 6.
11.2.4 A model for large-scale crustal
necking
Necking may manifest itself at crustal and lithospheric scales, on the Earth, on other planets and
on the moon of Jupiter, Ganymede (Fink and
Fletcher, 1981; Collins et al., 1998; Patel et al., 1999;
Dombard and McKinnon, 2001). The strikingly
regular succession of basins and ranges that form
the dominant structure in the Basin and Range
Province of the western United States (Fig. 11.13)
have been interpreted as the result of necking of
the strong brittle layer of the crust (Fletcher and
Hallet, 1983). The crust is broken up into segments
approximately 30 km in width (Fig. 11.14). These
are superposed on a subtler necking at a scale
Ͼ100 km in which the strong upper layer of the
mantle lithosphere plays a significant role (Zuber
436
RHEOLOGICAL BEHAVIOR
Fig 11.12 q d and L d /H for mullion structures for n ϭ3 and
n 1 Ն2.
0.2
0.6
1.0
1.4
1.8
1
2
3
4
2
5
15
20
25
30
40
6
8
8
10
Mullion, n =3
log 10 (R)
log
10 (n
1 )
10
q d =10
L d /H =6
of boudins is separated from any other segments
of the same layer by a distance at least comparable
to its length. While part of the deformation is tied
to the normal faulting, including the central neck
between the boudins, the overall form is more
suggestive of a continuous ductile necking.
Detailed study to support or refute this suggestion
has not been carried out by us. None-the-less, this
hypothesis provides a useful example for the
present discussion.
In Fig. 11.11b, we have constructed the rectangles approximating the initial boudin form for
the entire structure, supposing the central neck
to be a later feature, and for the two individual
boudins or pinch-and-swell structures. Their
aspect ratios are, for the entire structure, 4.2, and
for the individuals, 2.3 on the left and 2.7 on the
right. The value for the entire structure is consistent with model values of L d /H for n Ͼ Ͼ 1, but
those for the individual structures are not. It
might be suggested that the latter reflect the tendency for a mechanically isolated segment to
divide in two sub-equal segments if it becomes
unstable with respect to necking, in this case
chiefly by faulting. The present model applies
only to a continuous layer or a segment with very
large aspect ratio, and does not apply directly to
a process involving discrete faults (but see the
next section).
The present model may also be applied to the
initiation of the regular mullion structures
shown in Fig. 10.2b. The lobe-and-cusp morphology indicates that the layer has the lower effective
viscosity, or R Ͼ 1. These structures are produced
in layer-parallel shortening, so that
Using these and plane flow ( ϭ 0), (11.51) then provides a relation describing the growth or decay of
the pinch-and-swell perturbations whose selective
amplification give rise to the mullions. Appreciable instability requires that the host be nonlinear. We thus assign a typical stress exponent
(Table 11.1) to the layer, n ϭ 3, and determine the
variation of q d and L d /H in (n 1 , R)-space (Fig. 11.12).
Note that n 1 Ն 2. This figure is read in the same
manner as Fig. 11.10, with values of n and n 1 determining L d /H and q d , the “d” again denoting the
dominant or most rapidly amplifying component.
Sgn(D xx ) ϭ Ϫ1.
The strength of the instability is small unless the
host has a very large stress exponent, so that
mullion structures such as those seen in Fig. 10.2b
may be inferred to represent large amounts of
layer-parallel shortening. This might explain the
significant difference between the span-to-thickness ratio of these structures and the values of
L d /H Ն 6.
11.2.4 A model for large-scale crustal
necking
Necking may manifest itself at crustal and lithospheric scales, on the Earth, on other planets and
on the moon of Jupiter, Ganymede (Fink and
Fletcher, 1981; Collins et al., 1998; Patel et al., 1999;
Dombard and McKinnon, 2001). The strikingly
regular succession of basins and ranges that form
the dominant structure in the Basin and Range
Province of the western United States (Fig. 11.13)
have been interpreted as the result of necking of
the strong brittle layer of the crust (Fletcher and
Hallet, 1983). The crust is broken up into segments
approximately 30 km in width (Fig. 11.14). These
are superposed on a subtler necking at a scale
Ͼ100 km in which the strong upper layer of the
mantle lithosphere plays a significant role (Zuber
436
RHEOLOGICAL BEHAVIOR
Fig 11.12 q d and L d /H for mullion structures for n ϭ3 and
n 1 Ն2.
0.2
0.6
1.0
1.4
1.8
1
2
3
4
2
5
15
20
25
30
40
6
8
8
10
Mullion, n =3
log 10 (R)
log
10 (n
1 )
10
q d =10
L d /H =6