

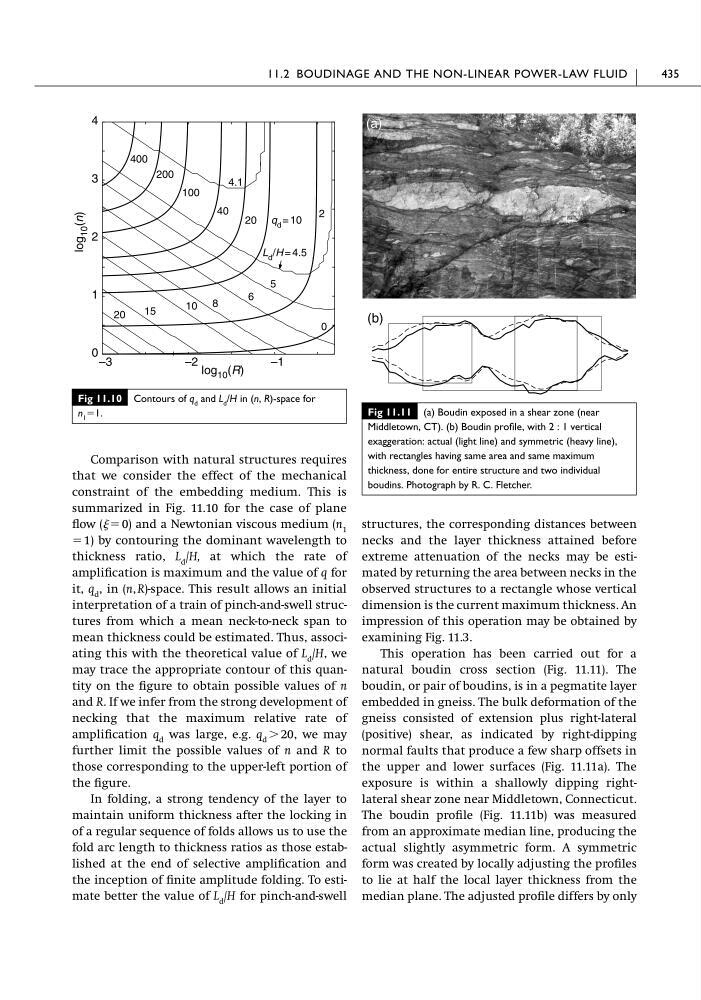
Comparison with natural structures requires
that we consider the effect of the mechanical
constraint of the embedding medium. This is
summarized in Fig. 11.10 for the case of plane
flow ( ϭ 0) and a Newtonian viscous medium (n 1
ϭ 1) by contouring the dominant wavelength to
thickness ratio, L d /H, at which the rate of
amplification is maximum and the value of q for
it, q d , in (n, R)-space. This result allows an initial
interpretation of a train of pinch-and-swell structures from which a mean neck-to-neck span to
mean thickness could be estimated. Thus, associating this with the theoretical value of L d /H, we
may trace the appropriate contour of this quantity on the figure to obtain possible values of n
and R. If we infer from the strong development of
necking that the maximum relative rate of
amplification q d was large, e.g. q d Ͼ 20, we may
further limit the possible values of n and R to
those corresponding to the upper-left portion of
the figure.
In folding, a strong tendency of the layer to
maintain uniform thickness after the locking in
of a regular sequence of folds allows us to use the
fold arc length to thickness ratios as those established at the end of selective amplification and
the inception of finite amplitude folding. To estimate better the value of L d /H for pinch-and-swell
structures, the corresponding distances between
necks and the layer thickness attained before
extreme attenuation of the necks may be estimated by returning the area between necks in the
observed structures to a rectangle whose vertical
dimension is the current maximum thickness. An
impression of this operation may be obtained by
examining Fig. 11.3.
This operation has been carried out for a
natural boudin cross section (Fig. 11.11). The
boudin, or pair of boudins, is in a pegmatite layer
embedded in gneiss. The bulk deformation of the
gneiss consisted of extension plus right-lateral
(positive) shear, as indicated by right-dipping
normal faults that produce a few sharp offsets in
the upper and lower surfaces (Fig. 11.11a). The
exposure is within a shallowly dipping rightlateral shear zone near Middletown, Connecticut.
The boudin profile (Fig. 11.11b) was measured
from an approximate median line, producing the
actual slightly asymmetric form. A symmetric
form was created by locally adjusting the profiles
to lie at half the local layer thickness from the
median plane. The adjusted profile differs by only
11.2 BOUDINAGE AND THE NON-LINEAR POWER-LAW FLUID
435
Fig 11.10 Contours of q d and L d /H in (n, R)-space for
n 1 ϭ1.
–3
–2
–1
0
1
2
3
4
0
2
20
40
100
200
400
6
8
15
20
log 10 (R)
q d = 10
5
4.1
10
log
10 (n)
L d /H = 4.5
Fig 11.11 (a) Boudin exposed in a shear zone (near
Middletown, CT). (b) Boudin profile, with 2 : 1 vertical
exaggeration: actual (light line) and symmetric (heavy line),
with rectangles having same area and same maximum
thickness, done for entire structure and two individual
boudins. Photograph by R. C. Fletcher.
(b)
(a)
that we consider the effect of the mechanical
constraint of the embedding medium. This is
summarized in Fig. 11.10 for the case of plane
flow ( ϭ 0) and a Newtonian viscous medium (n 1
ϭ 1) by contouring the dominant wavelength to
thickness ratio, L d /H, at which the rate of
amplification is maximum and the value of q for
it, q d , in (n, R)-space. This result allows an initial
interpretation of a train of pinch-and-swell structures from which a mean neck-to-neck span to
mean thickness could be estimated. Thus, associating this with the theoretical value of L d /H, we
may trace the appropriate contour of this quantity on the figure to obtain possible values of n
and R. If we infer from the strong development of
necking that the maximum relative rate of
amplification q d was large, e.g. q d Ͼ 20, we may
further limit the possible values of n and R to
those corresponding to the upper-left portion of
the figure.
In folding, a strong tendency of the layer to
maintain uniform thickness after the locking in
of a regular sequence of folds allows us to use the
fold arc length to thickness ratios as those established at the end of selective amplification and
the inception of finite amplitude folding. To estimate better the value of L d /H for pinch-and-swell
structures, the corresponding distances between
necks and the layer thickness attained before
extreme attenuation of the necks may be estimated by returning the area between necks in the
observed structures to a rectangle whose vertical
dimension is the current maximum thickness. An
impression of this operation may be obtained by
examining Fig. 11.3.
This operation has been carried out for a
natural boudin cross section (Fig. 11.11). The
boudin, or pair of boudins, is in a pegmatite layer
embedded in gneiss. The bulk deformation of the
gneiss consisted of extension plus right-lateral
(positive) shear, as indicated by right-dipping
normal faults that produce a few sharp offsets in
the upper and lower surfaces (Fig. 11.11a). The
exposure is within a shallowly dipping rightlateral shear zone near Middletown, Connecticut.
The boudin profile (Fig. 11.11b) was measured
from an approximate median line, producing the
actual slightly asymmetric form. A symmetric
form was created by locally adjusting the profiles
to lie at half the local layer thickness from the
median plane. The adjusted profile differs by only
11.2 BOUDINAGE AND THE NON-LINEAR POWER-LAW FLUID
435
Fig 11.10 Contours of q d and L d /H in (n, R)-space for
n 1 ϭ1.
–3
–2
–1
0
1
2
3
4
0
2
20
40
100
200
400
6
8
15
20
log 10 (R)
q d = 10
5
4.1
10
log
10 (n)
L d /H = 4.5
Fig 11.11 (a) Boudin exposed in a shear zone (near
Middletown, CT). (b) Boudin profile, with 2 : 1 vertical
exaggeration: actual (light line) and symmetric (heavy line),
with rectangles having same area and same maximum
thickness, done for entire structure and two individual
boudins. Photograph by R. C. Fletcher.
(b)
(a)