

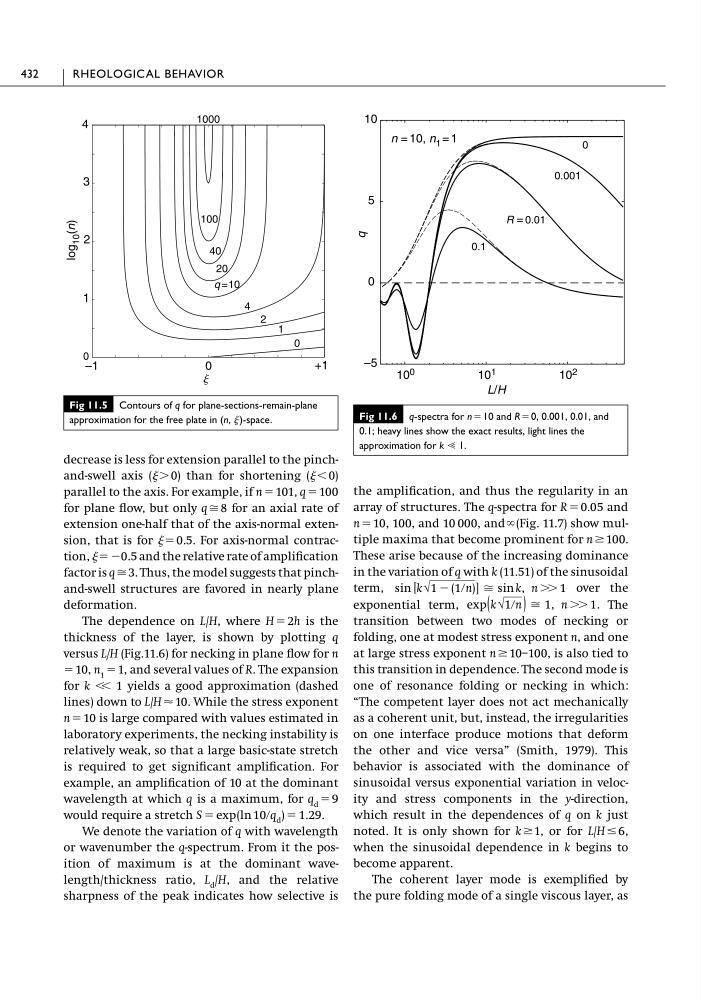
decrease is less for extension parallel to the pinchand-swell axis ( Ͼ 0) than for shortening ( Ͻ 0)
parallel to the axis. For example, if n ϭ 101, q ϭ 100
for plane flow, but only q Х 8 for an axial rate of
extension one-half that of the axis-normal extension, that is for ϭ 0.5. For axis-normal contraction, ϭϪ0.5 and the relative rate of amplification
factor is q Х 3. Thus, the model suggests that pinchand-swell structures are favored in nearly plane
deformation.
The dependence on L/H, where H ϭ 2h is the
thickness of the layer, is shown by plotting q
versus L/H (Fig.11.6) for necking in plane flow for n
ϭ 10, n 1 ϭ 1, and several values of R. The expansion
for k Ͻ Ͻ 1 yields a good approximation (dashed
lines) down to L/H Ϸ 10. While the stress exponent
n ϭ 10 is large compared with values estimated in
laboratory experiments, the necking instability is
relatively weak, so that a large basic-state stretch
is required to get significant amplification. For
example, an amplification of 10 at the dominant
wavelength at which q is a maximum, for q d ϭ 9
would require a stretch
We denote the variation of q with wavelength
or wavenumber the q-spectrum. From it the position of maximum is at the dominant wavelength/thickness ratio, L d /H, and the relative
sharpness of the peak indicates how selective is
S ϭ exp(ln 10րq d ) ϭ 1.29.
the amplification, and thus the regularity in an
array of structures. The q-spectra for R ϭ 0.05 and
n ϭ 10, 100, and 10 000, and ϱ (Fig. 11.7) show multiple maxima that become prominent for n Ն 100.
These arise because of the increasing dominance
in the variation of q with k (11.51) of the sinusoidal
term,
over the
exponential term,
The
transition between two modes of necking or
folding, one at modest stress exponent n, and one
at large stress exponent n Ն 10–100, is also tied to
this transition in dependence. The second mode is
one of resonance folding or necking in which:
“The competent layer does not act mechanically
as a coherent unit, but, instead, the irregularities
on one interface produce motions that deform
the other and vice versa” (Smith, 1979). This
behavior is associated with the dominance of
sinusoidal versus exponential variation in velocity and stress components in the y-direction,
which result in the dependences of q on k just
noted. It is only shown for k Ն1, or for L/H Յ 6,
when the sinusoidal dependence in k begins to
become apparent.
The coherent layer mode is exemplified by
the pure folding mode of a single viscous layer, as
exp(k √1րn ) Х 1, n ϾϾ 1.
sin [k√1 Ϫ (1րn)] Х sin k, n ϾϾ 1
432
RHEOLOGICAL BEHAVIOR
Fig 11.5 Contours of q for plane-sections-remain-plane
approximation for the free plate in (n, )-space.
–1
0
+1
0
3
4
0
2
4
20
100
q =10
40
1
1
2
log
10 (n)
j
1000
Fig 11.6 q-spectra for n ϭ10 and Rϭ 0, 0.001, 0.01, and
0.1; heavy lines show the exact results, light lines the
approximation for k Ӷ 1.
10 0
10 1
10 2
–5
0
5
10
L/H
q
R = 0.01
0.001
0
0.1
n = 10, n 1 = 1
parallel to the axis. For example, if n ϭ 101, q ϭ 100
for plane flow, but only q Х 8 for an axial rate of
extension one-half that of the axis-normal extension, that is for ϭ 0.5. For axis-normal contraction, ϭϪ0.5 and the relative rate of amplification
factor is q Х 3. Thus, the model suggests that pinchand-swell structures are favored in nearly plane
deformation.
The dependence on L/H, where H ϭ 2h is the
thickness of the layer, is shown by plotting q
versus L/H (Fig.11.6) for necking in plane flow for n
ϭ 10, n 1 ϭ 1, and several values of R. The expansion
for k Ͻ Ͻ 1 yields a good approximation (dashed
lines) down to L/H Ϸ 10. While the stress exponent
n ϭ 10 is large compared with values estimated in
laboratory experiments, the necking instability is
relatively weak, so that a large basic-state stretch
is required to get significant amplification. For
example, an amplification of 10 at the dominant
wavelength at which q is a maximum, for q d ϭ 9
would require a stretch
We denote the variation of q with wavelength
or wavenumber the q-spectrum. From it the position of maximum is at the dominant wavelength/thickness ratio, L d /H, and the relative
sharpness of the peak indicates how selective is
S ϭ exp(ln 10րq d ) ϭ 1.29.
the amplification, and thus the regularity in an
array of structures. The q-spectra for R ϭ 0.05 and
n ϭ 10, 100, and 10 000, and ϱ (Fig. 11.7) show multiple maxima that become prominent for n Ն 100.
These arise because of the increasing dominance
in the variation of q with k (11.51) of the sinusoidal
term,
over the
exponential term,
The
transition between two modes of necking or
folding, one at modest stress exponent n, and one
at large stress exponent n Ն 10–100, is also tied to
this transition in dependence. The second mode is
one of resonance folding or necking in which:
“The competent layer does not act mechanically
as a coherent unit, but, instead, the irregularities
on one interface produce motions that deform
the other and vice versa” (Smith, 1979). This
behavior is associated with the dominance of
sinusoidal versus exponential variation in velocity and stress components in the y-direction,
which result in the dependences of q on k just
noted. It is only shown for k Ն1, or for L/H Յ 6,
when the sinusoidal dependence in k begins to
become apparent.
The coherent layer mode is exemplified by
the pure folding mode of a single viscous layer, as
exp(k √1րn ) Х 1, n ϾϾ 1.
sin [k√1 Ϫ (1րn)] Х sin k, n ϾϾ 1
432
RHEOLOGICAL BEHAVIOR
Fig 11.5 Contours of q for plane-sections-remain-plane
approximation for the free plate in (n, )-space.
–1
0
+1
0
3
4
0
2
4
20
100
q =10
40
1
1
2
log
10 (n)
j
1000
Fig 11.6 q-spectra for n ϭ10 and Rϭ 0, 0.001, 0.01, and
0.1; heavy lines show the exact results, light lines the
approximation for k Ӷ 1.
10 0
10 1
10 2
–5
0
5
10
L/H
q
R = 0.01
0.001
0
0.1
n = 10, n 1 = 1