

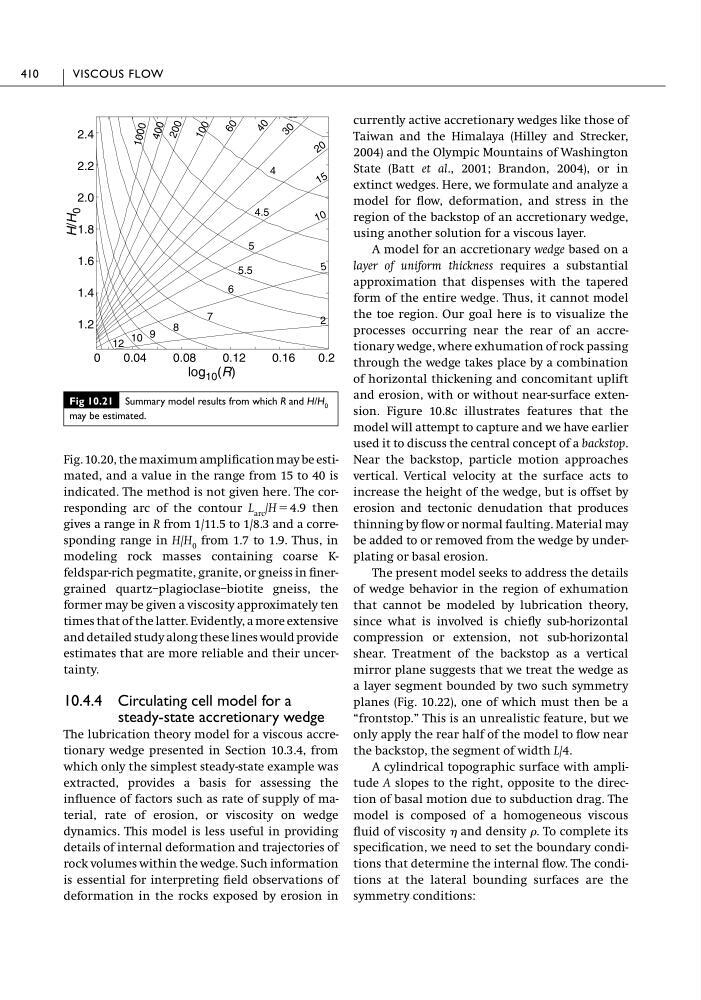
Fig. 10.20, the maximum amplification may be estimated, and a value in the range from 15 to 40 is
indicated. The method is not given here. The corresponding arc of the contour L arc /H ϭ 4.9 then
gives a range in R from 1/11.5 to 1/8.3 and a corresponding range in H/H 0 from 1.7 to 1.9. Thus, in
modeling rock masses containing coarse Kfeldspar-rich pegmatite, granite, or gneiss in finergrained quartz–plagioclase–biotite gneiss, the
former may be given a viscosity approximately ten
times that of the latter. Evidently, a more extensive
and detailed study along these lines would provide
estimates that are more reliable and their uncertainty.
10.4.4 Circulating cell model for a
steady-state accretionary wedge
The lubrication theory model for a viscous accretionary wedge presented in Section 10.3.4, from
which only the simplest steady-state example was
extracted, provides a basis for assessing the
influence of factors such as rate of supply of material, rate of erosion, or viscosity on wedge
dynamics. This model is less useful in providing
details of internal deformation and trajectories of
rock volumes within the wedge. Such information
is essential for interpreting field observations of
deformation in the rocks exposed by erosion in
currently active accretionary wedges like those of
Taiwan and the Himalaya (Hilley and Strecker,
2004) and the Olympic Mountains of Washington
State (Batt et al., 2001; Brandon, 2004), or in
extinct wedges. Here, we formulate and analyze a
model for flow, deformation, and stress in the
region of the backstop of an accretionary wedge,
using another solution for a viscous layer.
A model for an accretionary wedge based on a
layer of uniform thickness requires a substantial
approximation that dispenses with the tapered
form of the entire wedge. Thus, it cannot model
the toe region. Our goal here is to visualize the
processes occurring near the rear of an accretionary wedge, where exhumation of rock passing
through the wedge takes place by a combination
of horizontal thickening and concomitant uplift
and erosion, with or without near-surface extension. Figure 10.8c illustrates features that the
model will attempt to capture and we have earlier
used it to discuss the central concept of a backstop.
Near the backstop, particle motion approaches
vertical. Vertical velocity at the surface acts to
increase the height of the wedge, but is offset by
erosion and tectonic denudation that produces
thinning by flow or normal faulting. Material may
be added to or removed from the wedge by underplating or basal erosion.
The present model seeks to address the details
of wedge behavior in the region of exhumation
that cannot be modeled by lubrication theory,
since what is involved is chiefly sub-horizontal
compression or extension, not sub-horizontal
shear. Treatment of the backstop as a vertical
mirror plane suggests that we treat the wedge as
a layer segment bounded by two such symmetry
planes (Fig. 10.22), one of which must then be a
“frontstop.” This is an unrealistic feature, but we
only apply the rear half of the model to flow near
the backstop, the segment of width L/4.
A cylindrical topographic surface with amplitude A slopes to the right, opposite to the direction of basal motion due to subduction drag. The
model is composed of a homogeneous viscous
fluid of viscosity and density . To complete its
specification, we need to set the boundary conditions that determine the internal flow. The conditions at the lateral bounding surfaces are the
symmetry conditions:
410
VISCOUS FLOW
Fig 10.21 Summary model results from which R and H/H 0
may be estimated.
2
5
1 0
1 5
2 0
3 0
4 0
6 0
1 0 0
2 0 0
4 0 0
3.5
4
4.5
5
5.5
6
7
8
9
10
12
log 10 (R)
H/H
0
0
0.04
0.08
0.12
0.16
0.2
2.4
2.2
2.0
1.8
1.6
1.4
1.2
1 0 0 0
indicated. The method is not given here. The corresponding arc of the contour L arc /H ϭ 4.9 then
gives a range in R from 1/11.5 to 1/8.3 and a corresponding range in H/H 0 from 1.7 to 1.9. Thus, in
modeling rock masses containing coarse Kfeldspar-rich pegmatite, granite, or gneiss in finergrained quartz–plagioclase–biotite gneiss, the
former may be given a viscosity approximately ten
times that of the latter. Evidently, a more extensive
and detailed study along these lines would provide
estimates that are more reliable and their uncertainty.
10.4.4 Circulating cell model for a
steady-state accretionary wedge
The lubrication theory model for a viscous accretionary wedge presented in Section 10.3.4, from
which only the simplest steady-state example was
extracted, provides a basis for assessing the
influence of factors such as rate of supply of material, rate of erosion, or viscosity on wedge
dynamics. This model is less useful in providing
details of internal deformation and trajectories of
rock volumes within the wedge. Such information
is essential for interpreting field observations of
deformation in the rocks exposed by erosion in
currently active accretionary wedges like those of
Taiwan and the Himalaya (Hilley and Strecker,
2004) and the Olympic Mountains of Washington
State (Batt et al., 2001; Brandon, 2004), or in
extinct wedges. Here, we formulate and analyze a
model for flow, deformation, and stress in the
region of the backstop of an accretionary wedge,
using another solution for a viscous layer.
A model for an accretionary wedge based on a
layer of uniform thickness requires a substantial
approximation that dispenses with the tapered
form of the entire wedge. Thus, it cannot model
the toe region. Our goal here is to visualize the
processes occurring near the rear of an accretionary wedge, where exhumation of rock passing
through the wedge takes place by a combination
of horizontal thickening and concomitant uplift
and erosion, with or without near-surface extension. Figure 10.8c illustrates features that the
model will attempt to capture and we have earlier
used it to discuss the central concept of a backstop.
Near the backstop, particle motion approaches
vertical. Vertical velocity at the surface acts to
increase the height of the wedge, but is offset by
erosion and tectonic denudation that produces
thinning by flow or normal faulting. Material may
be added to or removed from the wedge by underplating or basal erosion.
The present model seeks to address the details
of wedge behavior in the region of exhumation
that cannot be modeled by lubrication theory,
since what is involved is chiefly sub-horizontal
compression or extension, not sub-horizontal
shear. Treatment of the backstop as a vertical
mirror plane suggests that we treat the wedge as
a layer segment bounded by two such symmetry
planes (Fig. 10.22), one of which must then be a
“frontstop.” This is an unrealistic feature, but we
only apply the rear half of the model to flow near
the backstop, the segment of width L/4.
A cylindrical topographic surface with amplitude A slopes to the right, opposite to the direction of basal motion due to subduction drag. The
model is composed of a homogeneous viscous
fluid of viscosity and density . To complete its
specification, we need to set the boundary conditions that determine the internal flow. The conditions at the lateral bounding surfaces are the
symmetry conditions:
410
VISCOUS FLOW
Fig 10.21 Summary model results from which R and H/H 0
may be estimated.
2
5
1 0
1 5
2 0
3 0
4 0
6 0
1 0 0
2 0 0
4 0 0
3.5
4
4.5
5
5.5
6
7
8
9
10
12
log 10 (R)
H/H
0
0
0.04
0.08
0.12
0.16
0.2
2.4
2.2
2.0
1.8
1.6
1.4
1.2
1 0 0 0