

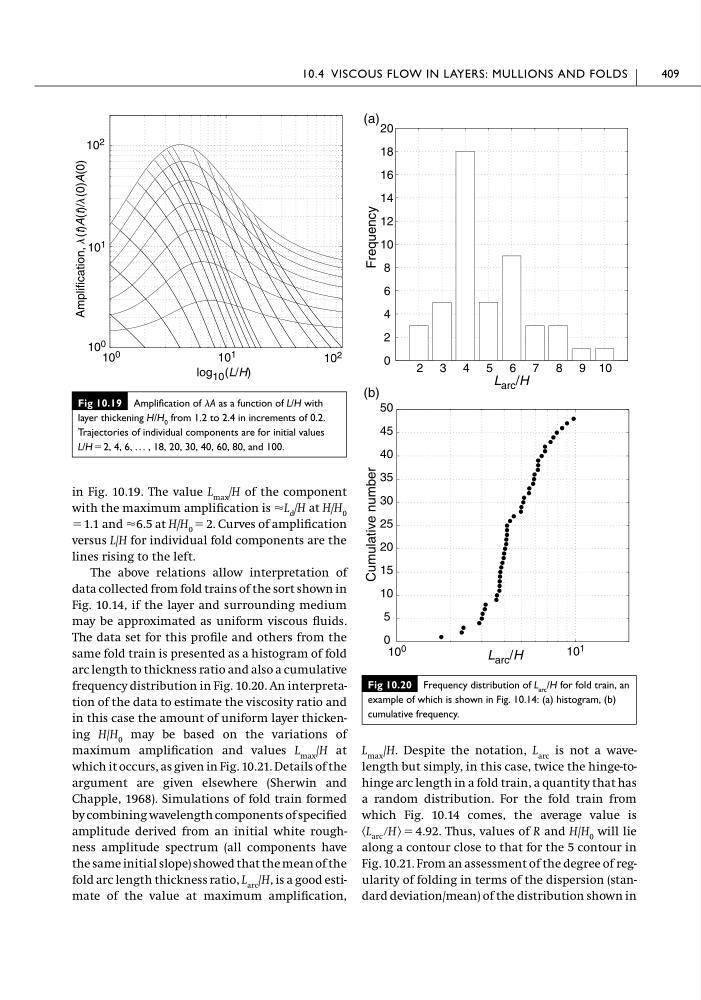
in Fig. 10.19. The value L max /H of the component
with the maximum amplification is ϷL d /H at H/H 0
ϭ 1.1 and Ϸ6.5 at H/H 0 ϭ 2. Curves of amplification
versus L/H for individual fold components are the
lines rising to the left.
The above relations allow interpretation of
data collected from fold trains of the sort shown in
Fig. 10.14, if the layer and surrounding medium
may be approximated as uniform viscous fluids.
The data set for this profile and others from the
same fold train is presented as a histogram of fold
arc length to thickness ratio and also a cumulative
frequency distribution in Fig. 10.20. An interpretation of the data to estimate the viscosity ratio and
in this case the amount of uniform layer thickening H/H 0 may be based on the variations of
maximum amplification and values L max /H at
which it occurs, as given in Fig. 10.21. Details of the
argument are given elsewhere (Sherwin and
Chapple, 1968). Simulations of fold train formed
by combining wavelength components of specified
amplitude derived from an initial white roughness amplitude spectrum (all components have
the same initial slope) showed that the mean of the
fold arc length thickness ratio, L arc /H, is a good estimate of the value at maximum amplification,
L max /H. Despite the notation, L arc is not a wavelength but simply, in this case, twice the hinge-tohinge arc length in a fold train, a quantity that has
a random distribution. For the fold train from
which Fig. 10.14 comes, the average value is
Thus, values of R and H/H 0 will lie
along a contour close to that for the 5 contour in
Fig. 10.21. From an assessment of the degree of regularity of folding in terms of the dispersion (standard deviation/mean) of the distribution shown in
͗L arc րH͘ ϭ 4.92.
10.4 VISCOUS FLOW IN LAYERS: MULLIONS AND FOLDS
409
Fig 10.19 Amplification of A as a function of L/H with
layer thickening H/H 0 from 1.2 to 2.4 in increments of 0.2.
Trajectories of individual components are for initial values
L/H ϭ 2, 4, 6, . . . , 18, 20, 30, 40, 60, 80, and 100.
log 10 (L/H)
10 0
10 2
10 1
10 0
10 1
10 2
Amplification, l(t)A(t)/l(0)A(0)
Fig 10.20 Frequency distribution of L arc /H for fold train, an
example of which is shown in Fig. 10.14: (a) histogram, (b)
cumulative frequency.
2 3 4 5 6 7 8 9 10
0
2
4
6
8
10
12
14
16
18
20
Frequency
L arc /H
(a)
0
5
10
15
20
25
30
35
40
45
50
L arc /H
10 1
10 0
Cumulative number
(b)
with the maximum amplification is ϷL d /H at H/H 0
ϭ 1.1 and Ϸ6.5 at H/H 0 ϭ 2. Curves of amplification
versus L/H for individual fold components are the
lines rising to the left.
The above relations allow interpretation of
data collected from fold trains of the sort shown in
Fig. 10.14, if the layer and surrounding medium
may be approximated as uniform viscous fluids.
The data set for this profile and others from the
same fold train is presented as a histogram of fold
arc length to thickness ratio and also a cumulative
frequency distribution in Fig. 10.20. An interpretation of the data to estimate the viscosity ratio and
in this case the amount of uniform layer thickening H/H 0 may be based on the variations of
maximum amplification and values L max /H at
which it occurs, as given in Fig. 10.21. Details of the
argument are given elsewhere (Sherwin and
Chapple, 1968). Simulations of fold train formed
by combining wavelength components of specified
amplitude derived from an initial white roughness amplitude spectrum (all components have
the same initial slope) showed that the mean of the
fold arc length thickness ratio, L arc /H, is a good estimate of the value at maximum amplification,
L max /H. Despite the notation, L arc is not a wavelength but simply, in this case, twice the hinge-tohinge arc length in a fold train, a quantity that has
a random distribution. For the fold train from
which Fig. 10.14 comes, the average value is
Thus, values of R and H/H 0 will lie
along a contour close to that for the 5 contour in
Fig. 10.21. From an assessment of the degree of regularity of folding in terms of the dispersion (standard deviation/mean) of the distribution shown in
͗L arc րH͘ ϭ 4.92.
10.4 VISCOUS FLOW IN LAYERS: MULLIONS AND FOLDS
409
Fig 10.19 Amplification of A as a function of L/H with
layer thickening H/H 0 from 1.2 to 2.4 in increments of 0.2.
Trajectories of individual components are for initial values
L/H ϭ 2, 4, 6, . . . , 18, 20, 30, 40, 60, 80, and 100.
log 10 (L/H)
10 0
10 2
10 1
10 0
10 1
10 2
Amplification, l(t)A(t)/l(0)A(0)
Fig 10.20 Frequency distribution of L arc /H for fold train, an
example of which is shown in Fig. 10.14: (a) histogram, (b)
cumulative frequency.
2 3 4 5 6 7 8 9 10
0
2
4
6
8
10
12
14
16
18
20
Frequency
L arc /H
(a)
0
5
10
15
20
25
30
35
40
45
50
L arc /H
10 1
10 0
Cumulative number
(b)