

(10.126)
Typically, only the first two terms are given in the
so-called “thin-plate approximation” (Biot, 1961),
but the third term improves the approximation
(Fig. 10.17). The expression (10.126) sums two
effects. The part of the curve descending as L/H
decreases is dominated by the term k
2 /6 in the
denominator, and is tied to the bending resistance of the layer; the part of the curve descending as L/H increases is dominated by the terms ϳR
and is associated with resistance of the medium to
layer deflection. At the dominant wavelength, the
two effects are balanced to give a maximum
growth rate.
Using only the two terms of (10.126) we have:
q Х 2 /
k 2
6
ϩ
2R
k
ϩ Rk
(10.127)
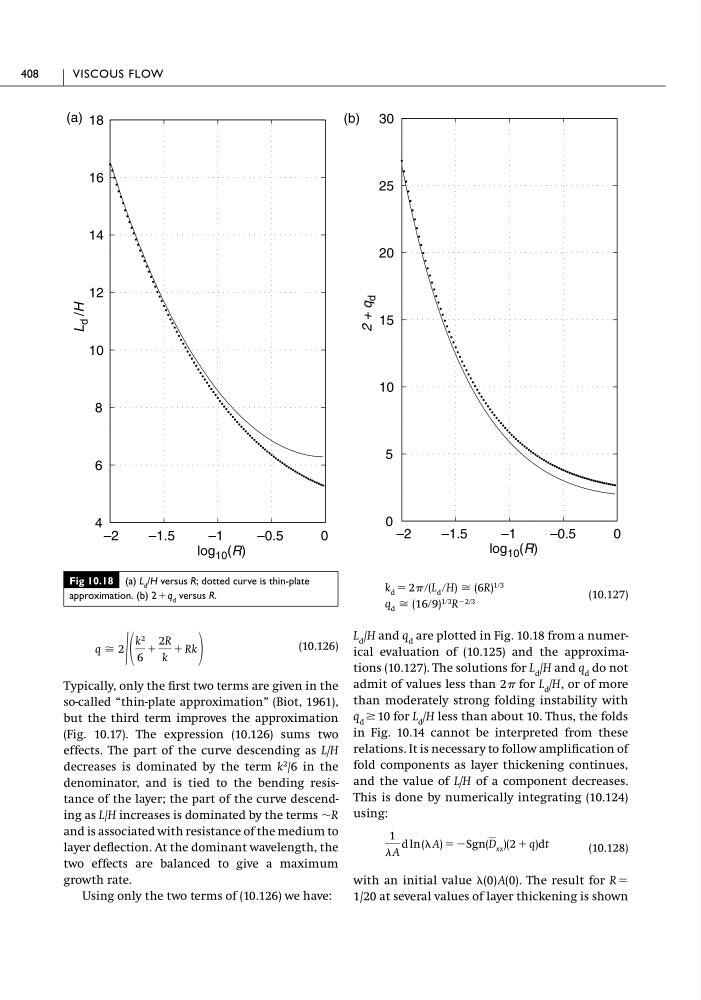
L d /H and q d are plotted in Fig. 10.18 from a numerical evaluation of (10.125) and the approximations (10.127). The solutions for L d /H and q d do not
admit of values less than 2 for L d /H, or of more
than moderately strong folding instability with
q d Ն 10 for L d /H less than about 10. Thus, the folds
in Fig. 10.14 cannot be interpreted from these
relations. It is necessary to follow amplification of
fold components as layer thickening continues,
and the value of L/H of a component decreases.
This is done by numerically integrating (10.124)
using:
(10.128)
with an initial value
. The result for R ϭ
1/20 at several values of layer thickening is shown
(0) A(0)
1
A
d ln ( A) ϭ ϪSgn(D xx )(2 ϩ q)dt
q d Х (16ր9) 1ր3 R Ϫ2ր3
k d ϭ 2 ր(L d րH) Х (6R) 1ր3
408
VISCOUS FLOW
Fig 10.18 (a) L d /H versus R; dotted curve is thin-plate
approximation. (b) 2ϩ q d versus R.
4
6
8
10
12
14
16
18
0
5
10
15
20
25
30
L
d /H
2 + q
d
–2
–1.5
–1
–0.5
0
log 10 (R)
–2
–1.5
–1
–0.5
0
log 10 (R)
(a)
(b)
Typically, only the first two terms are given in the
so-called “thin-plate approximation” (Biot, 1961),
but the third term improves the approximation
(Fig. 10.17). The expression (10.126) sums two
effects. The part of the curve descending as L/H
decreases is dominated by the term k
2 /6 in the
denominator, and is tied to the bending resistance of the layer; the part of the curve descending as L/H increases is dominated by the terms ϳR
and is associated with resistance of the medium to
layer deflection. At the dominant wavelength, the
two effects are balanced to give a maximum
growth rate.
Using only the two terms of (10.126) we have:
q Х 2 /
k 2
6
ϩ
2R
k
ϩ Rk
(10.127)
L d /H and q d are plotted in Fig. 10.18 from a numerical evaluation of (10.125) and the approximations (10.127). The solutions for L d /H and q d do not
admit of values less than 2 for L d /H, or of more
than moderately strong folding instability with
q d Ն 10 for L d /H less than about 10. Thus, the folds
in Fig. 10.14 cannot be interpreted from these
relations. It is necessary to follow amplification of
fold components as layer thickening continues,
and the value of L/H of a component decreases.
This is done by numerically integrating (10.124)
using:
(10.128)
with an initial value
. The result for R ϭ
1/20 at several values of layer thickening is shown
(0) A(0)
1
A
d ln ( A) ϭ ϪSgn(D xx )(2 ϩ q)dt
q d Х (16ր9) 1ր3 R Ϫ2ր3
k d ϭ 2 ր(L d րH) Х (6R) 1ր3
408
VISCOUS FLOW
Fig 10.18 (a) L d /H versus R; dotted curve is thin-plate
approximation. (b) 2ϩ q d versus R.
4
6
8
10
12
14
16
18
0
5
10
15
20
25
30
L
d /H
2 + q
d
–2
–1.5
–1
–0.5
0
log 10 (R)
–2
–1.5
–1
–0.5
0
log 10 (R)
(a)
(b)