

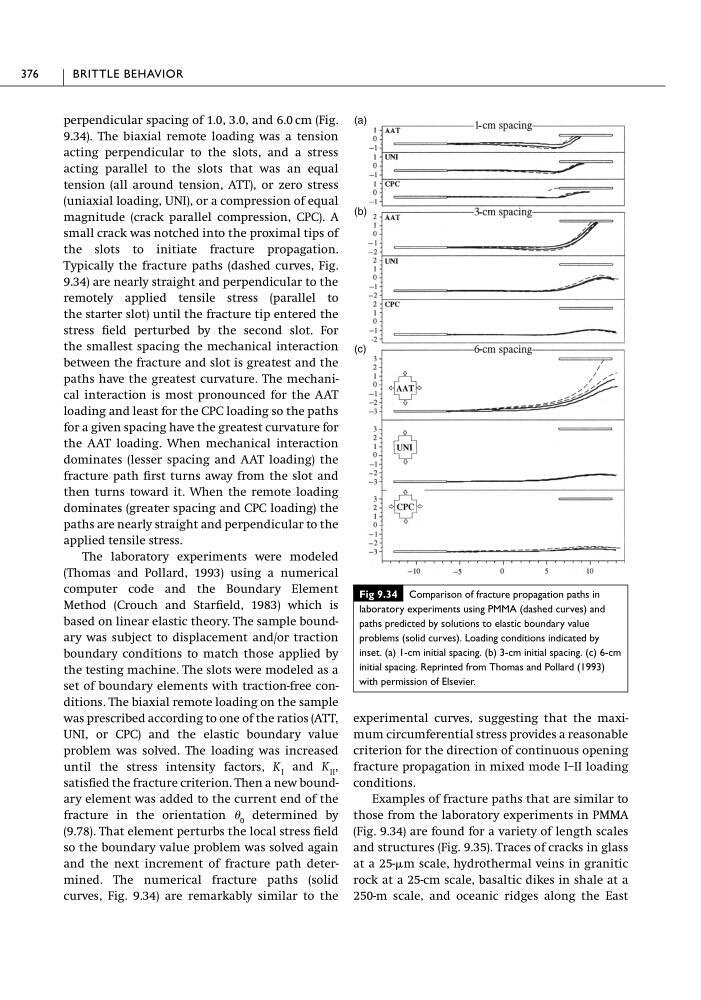
perpendicular spacing of 1.0, 3.0, and 6.0 cm (Fig.
9.34). The biaxial remote loading was a tension
acting perpendicular to the slots, and a stress
acting parallel to the slots that was an equal
tension (all around tension, ATT), or zero stress
(uniaxial loading, UNI), or a compression of equal
magnitude (crack parallel compression, CPC). A
small crack was notched into the proximal tips of
the slots to initiate fracture propagation.
Typically the fracture paths (dashed curves, Fig.
9.34) are nearly straight and perpendicular to the
remotely applied tensile stress (parallel to
the starter slot) until the fracture tip entered the
stress field perturbed by the second slot. For
the smallest spacing the mechanical interaction
between the fracture and slot is greatest and the
paths have the greatest curvature. The mechanical interaction is most pronounced for the AAT
loading and least for the CPC loading so the paths
for a given spacing have the greatest curvature for
the AAT loading. When mechanical interaction
dominates (lesser spacing and AAT loading) the
fracture path first turns away from the slot and
then turns toward it. When the remote loading
dominates (greater spacing and CPC loading) the
paths are nearly straight and perpendicular to the
applied tensile stress.
The laboratory experiments were modeled
(Thomas and Pollard, 1993) using a numerical
computer code and the Boundary Element
Method (Crouch and Starfield, 1983) which is
based on linear elastic theory. The sample boundary was subject to displacement and/or traction
boundary conditions to match those applied by
the testing machine. The slots were modeled as a
set of boundary elements with traction-free conditions. The biaxial remote loading on the sample
was prescribed according to one of the ratios (ATT,
UNI, or CPC) and the elastic boundary value
problem was solved. The loading was increased
until the stress intensity factors, K I and K II ,
satisfied the fracture criterion. Then a new boundary element was added to the current end of the
fracture in the orientation 0 determined by
(9.78). That element perturbs the local stress field
so the boundary value problem was solved again
and the next increment of fracture path determined. The numerical fracture paths (solid
curves, Fig. 9.34) are remarkably similar to the
experimental curves, suggesting that the maximum circumferential stress provides a reasonable
criterion for the direction of continuous opening
fracture propagation in mixed mode I–II loading
conditions.
Examples of fracture paths that are similar to
those from the laboratory experiments in PMMA
(Fig. 9.34) are found for a variety of length scales
and structures (Fig. 9.35). Traces of cracks in glass
at a 25-m scale, hydrothermal veins in granitic
rock at a 25-cm scale, basaltic dikes in shale at a
250-m scale, and oceanic ridges along the East
376
BRITTLE BEHAVIOR
Fig 9.34 Comparison of fracture propagation paths in
laboratory experiments using PMMA (dashed curves) and
paths predicted by solutions to elastic boundary value
problems (solid curves). Loading conditions indicated by
inset. (a) 1-cm initial spacing. (b) 3-cm initial spacing. (c) 6-cm
initial spacing. Reprinted from Thomas and Pollard (1993)
with permission of Elsevier.
(c)
(b)
(a)
-
-
-
9.34). The biaxial remote loading was a tension
acting perpendicular to the slots, and a stress
acting parallel to the slots that was an equal
tension (all around tension, ATT), or zero stress
(uniaxial loading, UNI), or a compression of equal
magnitude (crack parallel compression, CPC). A
small crack was notched into the proximal tips of
the slots to initiate fracture propagation.
Typically the fracture paths (dashed curves, Fig.
9.34) are nearly straight and perpendicular to the
remotely applied tensile stress (parallel to
the starter slot) until the fracture tip entered the
stress field perturbed by the second slot. For
the smallest spacing the mechanical interaction
between the fracture and slot is greatest and the
paths have the greatest curvature. The mechanical interaction is most pronounced for the AAT
loading and least for the CPC loading so the paths
for a given spacing have the greatest curvature for
the AAT loading. When mechanical interaction
dominates (lesser spacing and AAT loading) the
fracture path first turns away from the slot and
then turns toward it. When the remote loading
dominates (greater spacing and CPC loading) the
paths are nearly straight and perpendicular to the
applied tensile stress.
The laboratory experiments were modeled
(Thomas and Pollard, 1993) using a numerical
computer code and the Boundary Element
Method (Crouch and Starfield, 1983) which is
based on linear elastic theory. The sample boundary was subject to displacement and/or traction
boundary conditions to match those applied by
the testing machine. The slots were modeled as a
set of boundary elements with traction-free conditions. The biaxial remote loading on the sample
was prescribed according to one of the ratios (ATT,
UNI, or CPC) and the elastic boundary value
problem was solved. The loading was increased
until the stress intensity factors, K I and K II ,
satisfied the fracture criterion. Then a new boundary element was added to the current end of the
fracture in the orientation 0 determined by
(9.78). That element perturbs the local stress field
so the boundary value problem was solved again
and the next increment of fracture path determined. The numerical fracture paths (solid
curves, Fig. 9.34) are remarkably similar to the
experimental curves, suggesting that the maximum circumferential stress provides a reasonable
criterion for the direction of continuous opening
fracture propagation in mixed mode I–II loading
conditions.
Examples of fracture paths that are similar to
those from the laboratory experiments in PMMA
(Fig. 9.34) are found for a variety of length scales
and structures (Fig. 9.35). Traces of cracks in glass
at a 25-m scale, hydrothermal veins in granitic
rock at a 25-cm scale, basaltic dikes in shale at a
250-m scale, and oceanic ridges along the East
376
BRITTLE BEHAVIOR
Fig 9.34 Comparison of fracture propagation paths in
laboratory experiments using PMMA (dashed curves) and
paths predicted by solutions to elastic boundary value
problems (solid curves). Loading conditions indicated by
inset. (a) 1-cm initial spacing. (b) 3-cm initial spacing. (c) 6-cm
initial spacing. Reprinted from Thomas and Pollard (1993)
with permission of Elsevier.
(c)
(b)
(a)
-
-
-