

some shear stress, yx and/or yz , would be resolved
on the fracture plane. Here we consider the case
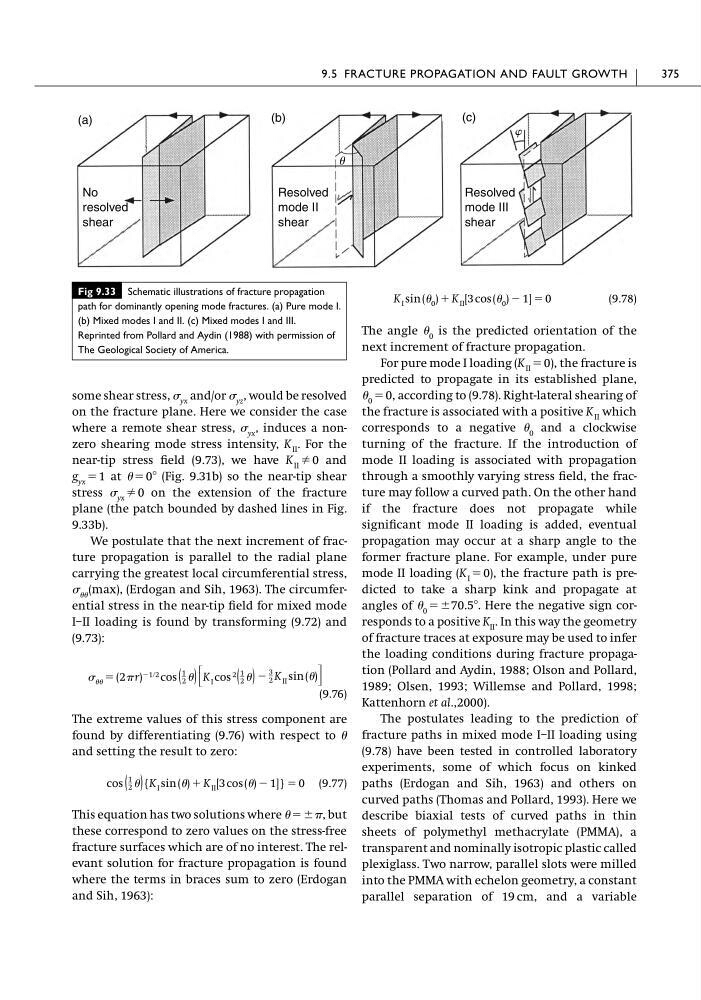
where a remote shear stress, yx , induces a nonzero shearing mode stress intensity, K II . For the
near-tip stress field (9.73), we have K II 0 and
g yx ϭ 1 at ϭ 0Њ (Fig. 9.31b) so the near-tip shear
stress yx 0 on the extension of the fracture
plane (the patch bounded by dashed lines in Fig.
9.33b).
We postulate that the next increment of fracture propagation is parallel to the radial plane
carrying the greatest local circumferential stress,
(max), (Erdogan and Sih, 1963). The circumferential stress in the near-tip field for mixed mode
I–II loading is found by transforming (9.72) and
(9.73):
(9.76)
The extreme values of this stress component are
found by differentiating (9.76) with respect to
and setting the result to zero:
(9.77)
This equation has two solutions where ϭϮ, but
these correspond to zero values on the stress-free
fracture surfaces which are of no interest. The relevant solution for fracture propagation is found
where the terms in braces sum to zero (Erdogan
and Sih, 1963):
cos (
1
2 ){K I sin () ϩ K II [3 cos () Ϫ 1]} ϭ 0
Ϫ
3
2 K II sin ()΅
ϭ (2 r) Ϫ1ր2 cos (
1
2 ) ΄K I cos 2 (
1
2 )
(9.78)
The angle 0 is the predicted orientation of the
next increment of fracture propagation.
For pure mode I loading (K II ϭ 0), the fracture is
predicted to propagate in its established plane,
0 ϭ 0, according to (9.78). Right-lateral shearing of
the fracture is associated with a positive K II which
corresponds to a negative 0 and a clockwise
turning of the fracture. If the introduction of
mode II loading is associated with propagation
through a smoothly varying stress field, the fracture may follow a curved path. On the other hand
if the fracture does not propagate while
significant mode II loading is added, eventual
propagation may occur at a sharp angle to the
former fracture plane. For example, under pure
mode II loading (K I ϭ 0), the fracture path is predicted to take a sharp kink and propagate at
angles of 0 ϭϮ70.5Њ. Here the negative sign corresponds to a positive K II . In this way the geometry
of fracture traces at exposure may be used to infer
the loading conditions during fracture propagation (Pollard and Aydin, 1988; Olson and Pollard,
1989; Olsen, 1993; Willemse and Pollard, 1998;
Kattenhorn et al.,2000).
The postulates leading to the prediction of
fracture paths in mixed mode I–II loading using
(9.78) have been tested in controlled laboratory
experiments, some of which focus on kinked
paths (Erdogan and Sih, 1963) and others on
curved paths (Thomas and Pollard, 1993). Here we
describe biaxial tests of curved paths in thin
sheets of polymethyl methacrylate (PMMA), a
transparent and nominally isotropic plastic called
plexiglass. Two narrow, parallel slots were milled
into the PMMA with echelon geometry, a constant
parallel separation of 19 cm, and a variable
K I sin ( 0 ) ϩ K II [3 cos ( 0 ) Ϫ 1] ϭ 0
9.5 FRACTURE PROPAGATION AND FAULT GROWTH
375
(a)
No
resolved
shear
Resolved
mode II
shear
Resolved
mode III
shear
(b)
(c)
u
W
Fig 9.33 Schematic illustrations of fracture propagation
path for dominantly opening mode fractures. (a) Pure mode I.
(b) Mixed modes I and II. (c) Mixed modes I and III.
Reprinted from Pollard and Aydin (1988) with permission of
The Geological Society of America.
on the fracture plane. Here we consider the case
where a remote shear stress, yx , induces a nonzero shearing mode stress intensity, K II . For the
near-tip stress field (9.73), we have K II 0 and
g yx ϭ 1 at ϭ 0Њ (Fig. 9.31b) so the near-tip shear
stress yx 0 on the extension of the fracture
plane (the patch bounded by dashed lines in Fig.
9.33b).
We postulate that the next increment of fracture propagation is parallel to the radial plane
carrying the greatest local circumferential stress,
(max), (Erdogan and Sih, 1963). The circumferential stress in the near-tip field for mixed mode
I–II loading is found by transforming (9.72) and
(9.73):
(9.76)
The extreme values of this stress component are
found by differentiating (9.76) with respect to
and setting the result to zero:
(9.77)
This equation has two solutions where ϭϮ, but
these correspond to zero values on the stress-free
fracture surfaces which are of no interest. The relevant solution for fracture propagation is found
where the terms in braces sum to zero (Erdogan
and Sih, 1963):
cos (
1
2 ){K I sin () ϩ K II [3 cos () Ϫ 1]} ϭ 0
Ϫ
3
2 K II sin ()΅
ϭ (2 r) Ϫ1ր2 cos (
1
2 ) ΄K I cos 2 (
1
2 )
(9.78)
The angle 0 is the predicted orientation of the
next increment of fracture propagation.
For pure mode I loading (K II ϭ 0), the fracture is
predicted to propagate in its established plane,
0 ϭ 0, according to (9.78). Right-lateral shearing of
the fracture is associated with a positive K II which
corresponds to a negative 0 and a clockwise
turning of the fracture. If the introduction of
mode II loading is associated with propagation
through a smoothly varying stress field, the fracture may follow a curved path. On the other hand
if the fracture does not propagate while
significant mode II loading is added, eventual
propagation may occur at a sharp angle to the
former fracture plane. For example, under pure
mode II loading (K I ϭ 0), the fracture path is predicted to take a sharp kink and propagate at
angles of 0 ϭϮ70.5Њ. Here the negative sign corresponds to a positive K II . In this way the geometry
of fracture traces at exposure may be used to infer
the loading conditions during fracture propagation (Pollard and Aydin, 1988; Olson and Pollard,
1989; Olsen, 1993; Willemse and Pollard, 1998;
Kattenhorn et al.,2000).
The postulates leading to the prediction of
fracture paths in mixed mode I–II loading using
(9.78) have been tested in controlled laboratory
experiments, some of which focus on kinked
paths (Erdogan and Sih, 1963) and others on
curved paths (Thomas and Pollard, 1993). Here we
describe biaxial tests of curved paths in thin
sheets of polymethyl methacrylate (PMMA), a
transparent and nominally isotropic plastic called
plexiglass. Two narrow, parallel slots were milled
into the PMMA with echelon geometry, a constant
parallel separation of 19 cm, and a variable
K I sin ( 0 ) ϩ K II [3 cos ( 0 ) Ϫ 1] ϭ 0
9.5 FRACTURE PROPAGATION AND FAULT GROWTH
375
(a)
No
resolved
shear
Resolved
mode II
shear
Resolved
mode III
shear
(b)
(c)
u
W
Fig 9.33 Schematic illustrations of fracture propagation
path for dominantly opening mode fractures. (a) Pure mode I.
(b) Mixed modes I and II. (c) Mixed modes I and III.
Reprinted from Pollard and Aydin (1988) with permission of
The Geological Society of America.