

experiments on Salem Limestone and Berea
Sandstone illustrated schematically in Fig. 9.18.
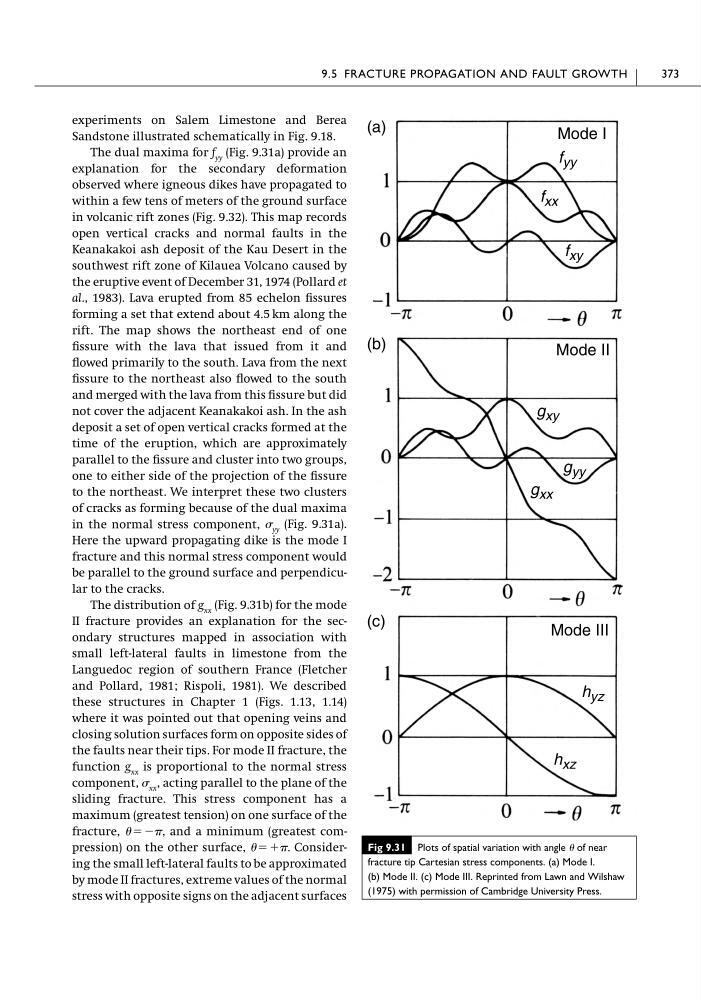
The dual maxima for f yy (Fig. 9.31a) provide an
explanation for the secondary deformation
observed where igneous dikes have propagated to
within a few tens of meters of the ground surface
in volcanic rift zones (Fig. 9.32). This map records
open vertical cracks and normal faults in the
Keanakakoi ash deposit of the Kau Desert in the
southwest rift zone of Kilauea Volcano caused by
the eruptive event of December 31, 1974 (Pollard et
al., 1983). Lava erupted from 85 echelon fissures
forming a set that extend about 4.5 km along the
rift. The map shows the northeast end of one
fissure with the lava that issued from it and
flowed primarily to the south. Lava from the next
fissure to the northeast also flowed to the south
and merged with the lava from this fissure but did
not cover the adjacent Keanakakoi ash. In the ash
deposit a set of open vertical cracks formed at the
time of the eruption, which are approximately
parallel to the fissure and cluster into two groups,
one to either side of the projection of the fissure
to the northeast. We interpret these two clusters
of cracks as forming because of the dual maxima
in the normal stress component, yy (Fig. 9.31a).
Here the upward propagating dike is the mode I
fracture and this normal stress component would
be parallel to the ground surface and perpendicular to the cracks.
The distribution of g xx (Fig. 9.31b) for the mode
II fracture provides an explanation for the secondary structures mapped in association with
small left-lateral faults in limestone from the
Languedoc region of southern France (Fletcher
and Pollard, 1981; Rispoli, 1981). We described
these structures in Chapter 1 (Figs. 1.13, 1.14)
where it was pointed out that opening veins and
closing solution surfaces form on opposite sides of
the faults near their tips. For mode II fracture, the
function g xx is proportional to the normal stress
component, xx , acting parallel to the plane of the
sliding fracture. This stress component has a
maximum (greatest tension) on one surface of the
fracture, ϭϪ, and a minimum (greatest compression) on the other surface, ϭϩ. Considering the small left-lateral faults to be approximated
by mode II fractures, extreme values of the normal
stress with opposite signs on the adjacent surfaces
9.5 FRACTURE PROPAGATION AND FAULT GROWTH
373
Fig 9.31 Plots of spatial variation with angle of near
fracture tip Cartesian stress components. (a) Mode I.
(b) Mode II. (c) Mode III. Reprinted from Lawn and Wilshaw
(1975) with permission of Cambridge University Press.
f yy
f xx
f xy
Mode I
Mode II
Mode III
g xy
g yy
g xx
h yz
h xz
(a)
(b)
(c)
Sandstone illustrated schematically in Fig. 9.18.
The dual maxima for f yy (Fig. 9.31a) provide an
explanation for the secondary deformation
observed where igneous dikes have propagated to
within a few tens of meters of the ground surface
in volcanic rift zones (Fig. 9.32). This map records
open vertical cracks and normal faults in the
Keanakakoi ash deposit of the Kau Desert in the
southwest rift zone of Kilauea Volcano caused by
the eruptive event of December 31, 1974 (Pollard et
al., 1983). Lava erupted from 85 echelon fissures
forming a set that extend about 4.5 km along the
rift. The map shows the northeast end of one
fissure with the lava that issued from it and
flowed primarily to the south. Lava from the next
fissure to the northeast also flowed to the south
and merged with the lava from this fissure but did
not cover the adjacent Keanakakoi ash. In the ash
deposit a set of open vertical cracks formed at the
time of the eruption, which are approximately
parallel to the fissure and cluster into two groups,
one to either side of the projection of the fissure
to the northeast. We interpret these two clusters
of cracks as forming because of the dual maxima
in the normal stress component, yy (Fig. 9.31a).
Here the upward propagating dike is the mode I
fracture and this normal stress component would
be parallel to the ground surface and perpendicular to the cracks.
The distribution of g xx (Fig. 9.31b) for the mode
II fracture provides an explanation for the secondary structures mapped in association with
small left-lateral faults in limestone from the
Languedoc region of southern France (Fletcher
and Pollard, 1981; Rispoli, 1981). We described
these structures in Chapter 1 (Figs. 1.13, 1.14)
where it was pointed out that opening veins and
closing solution surfaces form on opposite sides of
the faults near their tips. For mode II fracture, the
function g xx is proportional to the normal stress
component, xx , acting parallel to the plane of the
sliding fracture. This stress component has a
maximum (greatest tension) on one surface of the
fracture, ϭϪ, and a minimum (greatest compression) on the other surface, ϭϩ. Considering the small left-lateral faults to be approximated
by mode II fractures, extreme values of the normal
stress with opposite signs on the adjacent surfaces
9.5 FRACTURE PROPAGATION AND FAULT GROWTH
373
Fig 9.31 Plots of spatial variation with angle of near
fracture tip Cartesian stress components. (a) Mode I.
(b) Mode II. (c) Mode III. Reprinted from Lawn and Wilshaw
(1975) with permission of Cambridge University Press.
f yy
f xx
f xy
Mode I
Mode II
Mode III
g xy
g yy
g xx
h yz
h xz
(a)
(b)
(c)