

distribution. As the fracture tip is approached, ⌬x
becomes smaller and smaller relative to 2a, so yy
becomes larger and larger relative to a . This indicates that the stress is highly concentrated near
the fracture tip and it is this stress concentration
(Fig. 9.20b) that promotes fracture propagation.
Because the near-tip stress has the same dependence on distance for all opening fractures, we
can redirect our attention to the other quantities
in (9.33) and group them into a new parameter
called the stress intensity, K I :
(9.34)
Here the subscript I stands for mode I fracture and
indicates that the relative displacements of the
fracture surfaces produce an opening motion.
Later we consider the other two modes of fracture
in which the relative displacements of the fracture surfaces produce a shearing motion. For
other fracture geometries and other arrangements of the applied loads, equations comparable
to (9.34) are tabulated in engineering handbooks
(Tada et al., 1973).
The stress intensity is a measure of the magnitude of the local stresses anywhere in the fracture
tip region. Laboratory experiments have shown
that fracture propagation depends on this local
stress field and that one can write a propagation
criterion in terms of the stress intensity reaching
a critical value (Atkinson, 1987). The criterion is:
(9.35)
Here, K IC is called the critical stress intensity or
fracture toughness. The units and dimensions of
fracture toughness may be worked out from (9.34)
and are:
(9.36)
Fracture toughness is a property that measures
the resistance of a particular material to the propagation of a fracture. As such it should be independent of fracture size or geometry, but it may
depend on such things as the temperature,
confining pressure, and chemical environment.
A variety of laboratory procedures for measuring fracture toughness have been devised (Atkinson
and Meredith, 1987), and representative values for
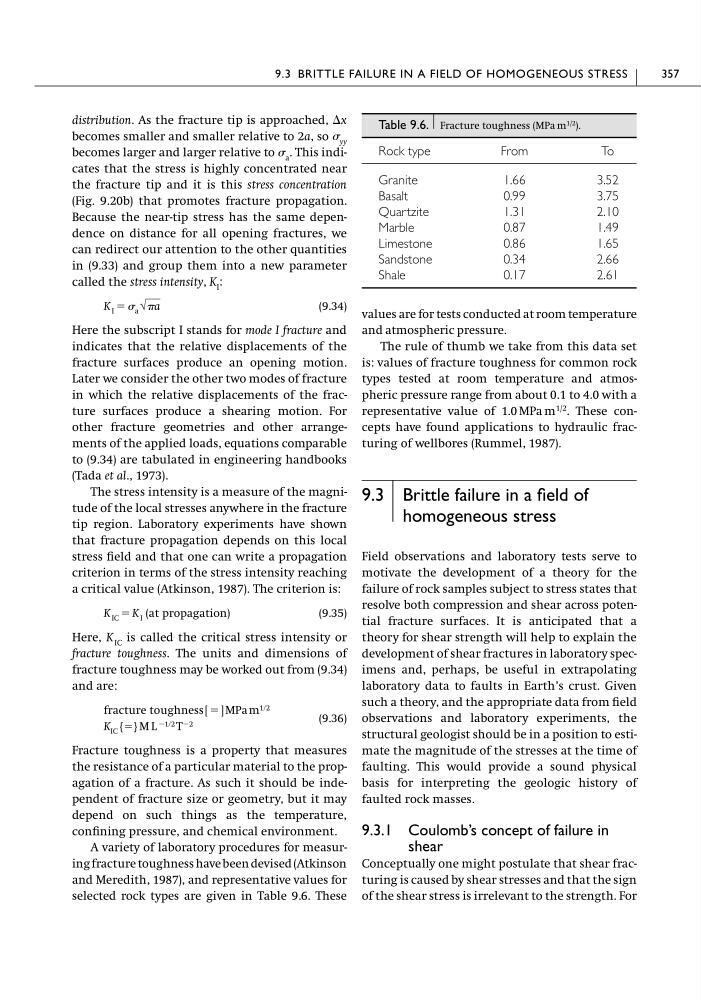
selected rock types are given in Table 9.6. These
K IC {ϭ} M L Ϫ1ր2 T Ϫ2
fracture toughness [ ϭ ] MPa m 1ր2
K IC ϭ K I (at propagation)
K I ϭ a √a
values are for tests conducted at room temperature
and atmospheric pressure.
The rule of thumb we take from this data set
is: values of fracture toughness for common rock
types tested at room temperature and atmospheric pressure range from about 0.1 to 4.0 with a
representative value of 1.0 MPa m
1/2 . These concepts have found applications to hydraulic fracturing of wellbores (Rummel, 1987).
9.3 Brittle failure in a field of
homogeneous stress
Field observations and laboratory tests serve to
motivate the development of a theory for the
failure of rock samples subject to stress states that
resolve both compression and shear across potential fracture surfaces. It is anticipated that a
theory for shear strength will help to explain the
development of shear fractures in laboratory specimens and, perhaps, be useful in extrapolating
laboratory data to faults in Earth’s crust. Given
such a theory, and the appropriate data from field
observations and laboratory experiments, the
structural geologist should be in a position to estimate the magnitude of the stresses at the time of
faulting. This would provide a sound physical
basis for interpreting the geologic history of
faulted rock masses.
9.3.1 Coulomb’s concept of failure in
shear
Conceptually one might postulate that shear fracturing is caused by shear stresses and that the sign
of the shear stress is irrelevant to the strength. For
9.3 BRITTLE FAILURE IN A FIELD OF HOMOGENEOUS STRESS
357
Table 9.6. Fracture toughness (MPa m
1/2
).
Rock type
From
To
Granite
1.66
3.52
Basalt
0.99
3.75
Quartzite
1.31
2.10
Marble
0.87
1.49
Limestone
0.86
1.65
Sandstone
0.34
2.66
Shale
0.17
2.61
becomes smaller and smaller relative to 2a, so yy
becomes larger and larger relative to a . This indicates that the stress is highly concentrated near
the fracture tip and it is this stress concentration
(Fig. 9.20b) that promotes fracture propagation.
Because the near-tip stress has the same dependence on distance for all opening fractures, we
can redirect our attention to the other quantities
in (9.33) and group them into a new parameter
called the stress intensity, K I :
(9.34)
Here the subscript I stands for mode I fracture and
indicates that the relative displacements of the
fracture surfaces produce an opening motion.
Later we consider the other two modes of fracture
in which the relative displacements of the fracture surfaces produce a shearing motion. For
other fracture geometries and other arrangements of the applied loads, equations comparable
to (9.34) are tabulated in engineering handbooks
(Tada et al., 1973).
The stress intensity is a measure of the magnitude of the local stresses anywhere in the fracture
tip region. Laboratory experiments have shown
that fracture propagation depends on this local
stress field and that one can write a propagation
criterion in terms of the stress intensity reaching
a critical value (Atkinson, 1987). The criterion is:
(9.35)
Here, K IC is called the critical stress intensity or
fracture toughness. The units and dimensions of
fracture toughness may be worked out from (9.34)
and are:
(9.36)
Fracture toughness is a property that measures
the resistance of a particular material to the propagation of a fracture. As such it should be independent of fracture size or geometry, but it may
depend on such things as the temperature,
confining pressure, and chemical environment.
A variety of laboratory procedures for measuring fracture toughness have been devised (Atkinson
and Meredith, 1987), and representative values for
selected rock types are given in Table 9.6. These
K IC {ϭ} M L Ϫ1ր2 T Ϫ2
fracture toughness [ ϭ ] MPa m 1ր2
K IC ϭ K I (at propagation)
K I ϭ a √a
values are for tests conducted at room temperature
and atmospheric pressure.
The rule of thumb we take from this data set
is: values of fracture toughness for common rock
types tested at room temperature and atmospheric pressure range from about 0.1 to 4.0 with a
representative value of 1.0 MPa m
1/2 . These concepts have found applications to hydraulic fracturing of wellbores (Rummel, 1987).
9.3 Brittle failure in a field of
homogeneous stress
Field observations and laboratory tests serve to
motivate the development of a theory for the
failure of rock samples subject to stress states that
resolve both compression and shear across potential fracture surfaces. It is anticipated that a
theory for shear strength will help to explain the
development of shear fractures in laboratory specimens and, perhaps, be useful in extrapolating
laboratory data to faults in Earth’s crust. Given
such a theory, and the appropriate data from field
observations and laboratory experiments, the
structural geologist should be in a position to estimate the magnitude of the stresses at the time of
faulting. This would provide a sound physical
basis for interpreting the geologic history of
faulted rock masses.
9.3.1 Coulomb’s concept of failure in
shear
Conceptually one might postulate that shear fracturing is caused by shear stresses and that the sign
of the shear stress is irrelevant to the strength. For
9.3 BRITTLE FAILURE IN A FIELD OF HOMOGENEOUS STRESS
357
Table 9.6. Fracture toughness (MPa m
1/2
).
Rock type
From
To
Granite
1.66
3.52
Basalt
0.99
3.75
Quartzite
1.31
2.10
Marble
0.87
1.49
Limestone
0.86
1.65
Sandstone
0.34
2.66
Shale
0.17
2.61