

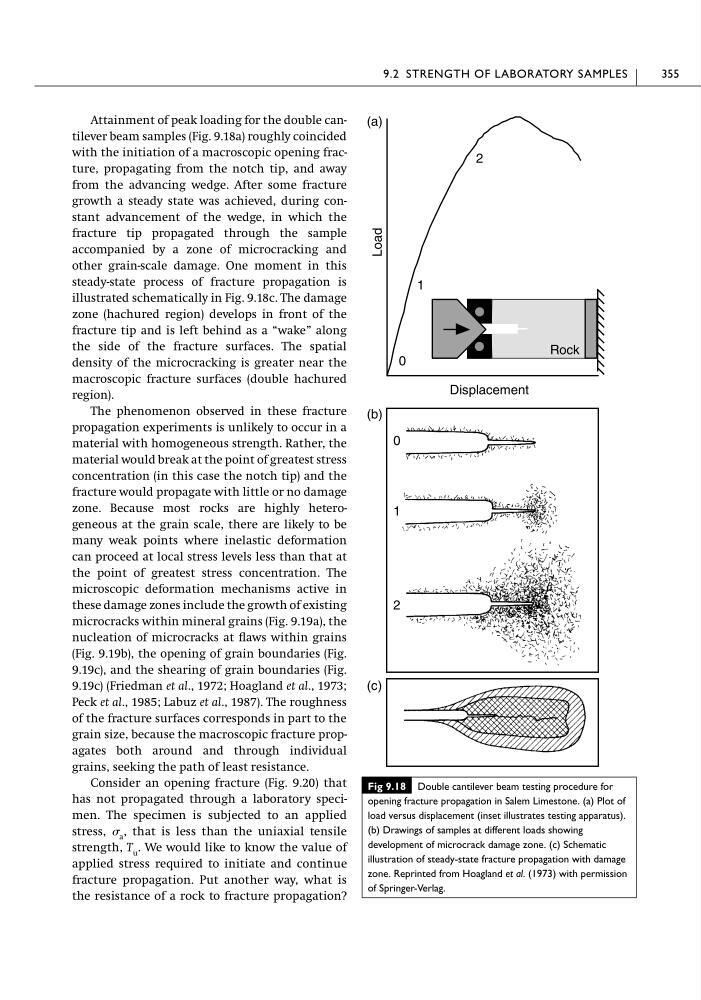
Attainment of peak loading for the double cantilever beam samples (Fig. 9.18a) roughly coincided
with the initiation of a macroscopic opening fracture, propagating from the notch tip, and away
from the advancing wedge. After some fracture
growth a steady state was achieved, during constant advancement of the wedge, in which the
fracture tip propagated through the sample
accompanied by a zone of microcracking and
other grain-scale damage. One moment in this
steady-state process of fracture propagation is
illustrated schematically in Fig. 9.18c. The damage
zone (hachured region) develops in front of the
fracture tip and is left behind as a “wake” along
the side of the fracture surfaces. The spatial
density of the microcracking is greater near the
macroscopic fracture surfaces (double hachured
region).
The phenomenon observed in these fracture
propagation experiments is unlikely to occur in a
material with homogeneous strength. Rather, the
material would break at the point of greatest stress
concentration (in this case the notch tip) and the
fracture would propagate with little or no damage
zone. Because most rocks are highly heterogeneous at the grain scale, there are likely to be
many weak points where inelastic deformation
can proceed at local stress levels less than that at
the point of greatest stress concentration. The
microscopic deformation mechanisms active in
these damage zones include the growth of existing
microcracks within mineral grains (Fig. 9.19a), the
nucleation of microcracks at flaws within grains
(Fig. 9.19b), the opening of grain boundaries (Fig.
9.19c), and the shearing of grain boundaries (Fig.
9.19c) (Friedman et al., 1972; Hoagland et al., 1973;
Peck et al., 1985; Labuz et al., 1987). The roughness
of the fracture surfaces corresponds in part to the
grain size, because the macroscopic fracture propagates both around and through individual
grains, seeking the path of least resistance.
Consider an opening fracture (Fig. 9.20) that
has not propagated through a laboratory specimen. The specimen is subjected to an applied
stress, a , that is less than the uniaxial tensile
strength, T u . We would like to know the value of
applied stress required to initiate and continue
fracture propagation. Put another way, what is
the resistance of a rock to fracture propagation?
9.2 STRENGTH OF LABORATORY SAMPLES
355
Fig 9.18 Double cantilever beam testing procedure for
opening fracture propagation in Salem Limestone. (a) Plot of
load versus displacement (inset illustrates testing apparatus).
(b) Drawings of samples at different loads showing
development of microcrack damage zone. (c) Schematic
illustration of steady-state fracture propagation with damage
zone. Reprinted from Hoagland et al. (1973) with permission
of Springer-Verlag.
Rock
0
1
2
Displacement
Load
2
1
0
(c)
(a)
(b)
with the initiation of a macroscopic opening fracture, propagating from the notch tip, and away
from the advancing wedge. After some fracture
growth a steady state was achieved, during constant advancement of the wedge, in which the
fracture tip propagated through the sample
accompanied by a zone of microcracking and
other grain-scale damage. One moment in this
steady-state process of fracture propagation is
illustrated schematically in Fig. 9.18c. The damage
zone (hachured region) develops in front of the
fracture tip and is left behind as a “wake” along
the side of the fracture surfaces. The spatial
density of the microcracking is greater near the
macroscopic fracture surfaces (double hachured
region).
The phenomenon observed in these fracture
propagation experiments is unlikely to occur in a
material with homogeneous strength. Rather, the
material would break at the point of greatest stress
concentration (in this case the notch tip) and the
fracture would propagate with little or no damage
zone. Because most rocks are highly heterogeneous at the grain scale, there are likely to be
many weak points where inelastic deformation
can proceed at local stress levels less than that at
the point of greatest stress concentration. The
microscopic deformation mechanisms active in
these damage zones include the growth of existing
microcracks within mineral grains (Fig. 9.19a), the
nucleation of microcracks at flaws within grains
(Fig. 9.19b), the opening of grain boundaries (Fig.
9.19c), and the shearing of grain boundaries (Fig.
9.19c) (Friedman et al., 1972; Hoagland et al., 1973;
Peck et al., 1985; Labuz et al., 1987). The roughness
of the fracture surfaces corresponds in part to the
grain size, because the macroscopic fracture propagates both around and through individual
grains, seeking the path of least resistance.
Consider an opening fracture (Fig. 9.20) that
has not propagated through a laboratory specimen. The specimen is subjected to an applied
stress, a , that is less than the uniaxial tensile
strength, T u . We would like to know the value of
applied stress required to initiate and continue
fracture propagation. Put another way, what is
the resistance of a rock to fracture propagation?
9.2 STRENGTH OF LABORATORY SAMPLES
355
Fig 9.18 Double cantilever beam testing procedure for
opening fracture propagation in Salem Limestone. (a) Plot of
load versus displacement (inset illustrates testing apparatus).
(b) Drawings of samples at different loads showing
development of microcrack damage zone. (c) Schematic
illustration of steady-state fracture propagation with damage
zone. Reprinted from Hoagland et al. (1973) with permission
of Springer-Verlag.
Rock
0
1
2
Displacement
Load
2
1
0
(c)
(a)
(b)