

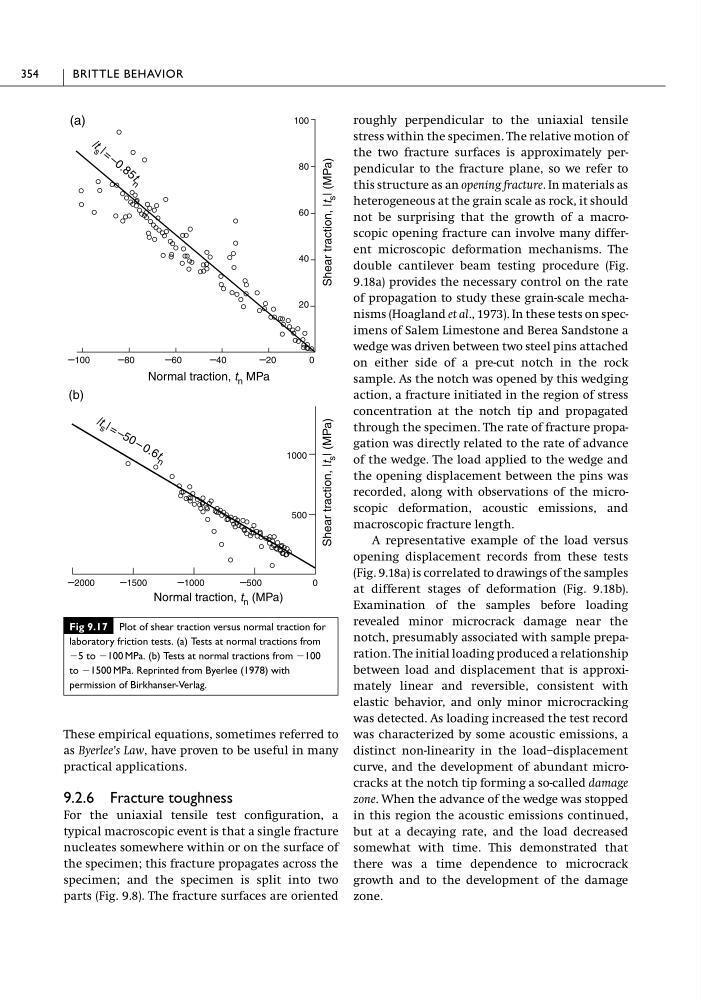
These empirical equations, sometimes referred to
as Byerlee’s Law, have proven to be useful in many
practical applications.
9.2.6 Fracture toughness
For the uniaxial tensile test configuration, a
typical macroscopic event is that a single fracture
nucleates somewhere within or on the surface of
the specimen; this fracture propagates across the
specimen; and the specimen is split into two
parts (Fig. 9.8). The fracture surfaces are oriented
roughly perpendicular to the uniaxial tensile
stress within the specimen. The relative motion of
the two fracture surfaces is approximately perpendicular to the fracture plane, so we refer to
this structure as an opening fracture. In materials as
heterogeneous at the grain scale as rock, it should
not be surprising that the growth of a macroscopic opening fracture can involve many different microscopic deformation mechanisms. The
double cantilever beam testing procedure (Fig.
9.18a) provides the necessary control on the rate
of propagation to study these grain-scale mechanisms (Hoagland et al., 1973). In these tests on specimens of Salem Limestone and Berea Sandstone a
wedge was driven between two steel pins attached
on either side of a pre-cut notch in the rock
sample. As the notch was opened by this wedging
action, a fracture initiated in the region of stress
concentration at the notch tip and propagated
through the specimen. The rate of fracture propagation was directly related to the rate of advance
of the wedge. The load applied to the wedge and
the opening displacement between the pins was
recorded, along with observations of the microscopic deformation, acoustic emissions, and
macroscopic fracture length.
A representative example of the load versus
opening displacement records from these tests
(Fig. 9.18a) is correlated to drawings of the samples
at different stages of deformation (Fig. 9.18b).
Examination of the samples before loading
revealed minor microcrack damage near the
notch, presumably associated with sample preparation. The initial loading produced a relationship
between load and displacement that is approximately linear and reversible, consistent with
elastic behavior, and only minor microcracking
was detected. As loading increased the test record
was characterized by some acoustic emissions, a
distinct non-linearity in the load–displacement
curve, and the development of abundant microcracks at the notch tip forming a so-called damage
zone. When the advance of the wedge was stopped
in this region the acoustic emissions continued,
but at a decaying rate, and the load decreased
somewhat with time. This demonstrated that
there was a time dependence to microcrack
growth and to the development of the damage
zone.
354
BRITTLE BEHAVIOR
Fig 9.17 Plot of shear traction versus normal traction for
laboratory friction tests. (a) Tests at normal tractions from
Ϫ5 to Ϫ100 MPa. (b) Tests at normal tractions from Ϫ100
to Ϫ1500 MPa. Reprinted from Byerlee (1978) with
permission of Birkhanser-Verlag.
(a)
(b)
Shear traction, |t
s | (MPa)
Shear traction, |t
s | (MPa)
Normal traction, t n (MPa)
–100
–80
–60
–40
–20
0
100
80
60
40
20
|
t
s | = – 0 . 8 5
t
n
1000
500
| t s | = – 5 0 – 0 . 6 t n
–2000
–1500
–1000
–500
0
Normal traction, t n MPa
as Byerlee’s Law, have proven to be useful in many
practical applications.
9.2.6 Fracture toughness
For the uniaxial tensile test configuration, a
typical macroscopic event is that a single fracture
nucleates somewhere within or on the surface of
the specimen; this fracture propagates across the
specimen; and the specimen is split into two
parts (Fig. 9.8). The fracture surfaces are oriented
roughly perpendicular to the uniaxial tensile
stress within the specimen. The relative motion of
the two fracture surfaces is approximately perpendicular to the fracture plane, so we refer to
this structure as an opening fracture. In materials as
heterogeneous at the grain scale as rock, it should
not be surprising that the growth of a macroscopic opening fracture can involve many different microscopic deformation mechanisms. The
double cantilever beam testing procedure (Fig.
9.18a) provides the necessary control on the rate
of propagation to study these grain-scale mechanisms (Hoagland et al., 1973). In these tests on specimens of Salem Limestone and Berea Sandstone a
wedge was driven between two steel pins attached
on either side of a pre-cut notch in the rock
sample. As the notch was opened by this wedging
action, a fracture initiated in the region of stress
concentration at the notch tip and propagated
through the specimen. The rate of fracture propagation was directly related to the rate of advance
of the wedge. The load applied to the wedge and
the opening displacement between the pins was
recorded, along with observations of the microscopic deformation, acoustic emissions, and
macroscopic fracture length.
A representative example of the load versus
opening displacement records from these tests
(Fig. 9.18a) is correlated to drawings of the samples
at different stages of deformation (Fig. 9.18b).
Examination of the samples before loading
revealed minor microcrack damage near the
notch, presumably associated with sample preparation. The initial loading produced a relationship
between load and displacement that is approximately linear and reversible, consistent with
elastic behavior, and only minor microcracking
was detected. As loading increased the test record
was characterized by some acoustic emissions, a
distinct non-linearity in the load–displacement
curve, and the development of abundant microcracks at the notch tip forming a so-called damage
zone. When the advance of the wedge was stopped
in this region the acoustic emissions continued,
but at a decaying rate, and the load decreased
somewhat with time. This demonstrated that
there was a time dependence to microcrack
growth and to the development of the damage
zone.
354
BRITTLE BEHAVIOR
Fig 9.17 Plot of shear traction versus normal traction for
laboratory friction tests. (a) Tests at normal tractions from
Ϫ5 to Ϫ100 MPa. (b) Tests at normal tractions from Ϫ100
to Ϫ1500 MPa. Reprinted from Byerlee (1978) with
permission of Birkhanser-Verlag.
(a)
(b)
Shear traction, |t
s | (MPa)
Shear traction, |t
s | (MPa)
Normal traction, t n (MPa)
–100
–80
–60
–40
–20
0
100
80
60
40
20
|
t
s | = – 0 . 8 5
t
n
1000
500
| t s | = – 5 0 – 0 . 6 t n
–2000
–1500
–1000
–500
0
Normal traction, t n MPa