

specimens are described as “moderately rough”
and the behavior is believed to be representative
of many rock types ( Jaeger and Cook, 1979). Note
that the intercept on the shear traction axis is not
zero for any of the data sets, so a more general
linear relationship than (9.29) is required:
(9.30)
The intercept on the ordinate, S f , is the frictional
strength in the absence of any normal traction and
the slope c is the coefficient of friction. This linear
relationship is identical in form to Coulomb’s criterion for the shear strength of intact solids which
is described later in this chapter (9.38). The
Coulomb criterion applies to the interior of a continuous solid rather than to discrete surfaces in
frictional contact. The mathematical similarity of
these equations should not obscure the fact that
the former describes a friction experiment where
sliding is induced along two surfaces in contact,
whereas the latter describes the initiation of a
shear fracture in an otherwise unbroken solid.
Laboratory experiments also have demonstrated
that friction is dependent upon the velocity of
sliding and the time of contact (Dieterich, 1979a,
b, 1981; Kilgore et al., 1993).
Given data that define the linear relationship
(9.30), the static friction, s , is derived from the
frictional strength and coefficient of friction as
follows:
(9.31)
For values of the normal traction less than or comparable to the frictional strength, the first term on
the right-hand side makes a significant contribution to the static friction. Under these conditions
it is not appropriate to equate the coefficient of
friction and the static friction. If the normal traction is much greater than the frictional strength,
the first term becomes insignificant and the
coefficient of friction approaches the value of the
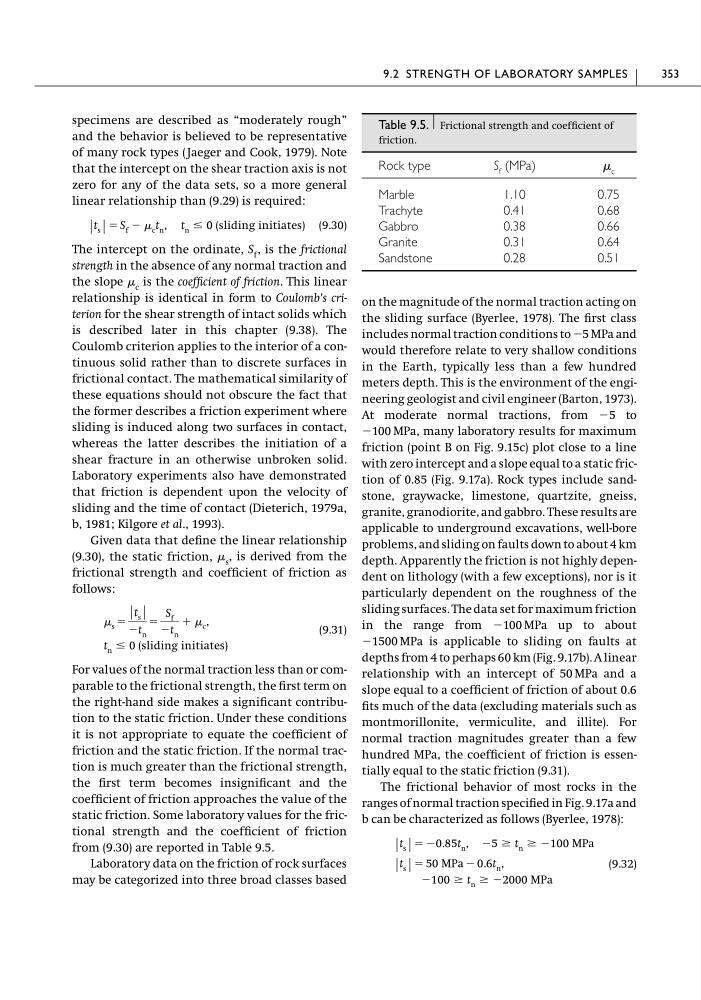
static friction. Some laboratory values for the frictional strength and the coefficient of friction
from (9.30) are reported in Table 9.5.
Laboratory data on the friction of rock surfaces
may be categorized into three broad classes based
t n Յ 0 (sliding initiates)
s ϭ
|t s |
Ϫt n
ϭ
S f
Ϫt n
ϩ c ,
|t s | ϭ S f Ϫ c t n , t n Յ 0 (sliding initiates)
on the magnitude of the normal traction acting on
the sliding surface (Byerlee, 1978). The first class
includes normal traction conditions to Ϫ5 MPa and
would therefore relate to very shallow conditions
in the Earth, typically less than a few hundred
meters depth. This is the environment of the engineering geologist and civil engineer (Barton, 1973).
At moderate normal tractions, from Ϫ5 to
Ϫ100 MPa, many laboratory results for maximum
friction (point B on Fig. 9.15c) plot close to a line
with zero intercept and a slope equal to a static friction of 0.85 (Fig. 9.17a). Rock types include sandstone, graywacke, limestone, quartzite, gneiss,
granite, granodiorite, and gabbro. These results are
applicable to underground excavations, well-bore
problems, and sliding on faults down to about 4 km
depth. Apparently the friction is not highly dependent on lithology (with a few exceptions), nor is it
particularly dependent on the roughness of the
sliding surfaces. The data set for maximum friction
in the range from Ϫ100 MPa up to about
Ϫ1500 MPa is applicable to sliding on faults at
depths from 4 to perhaps 60 km (Fig. 9.17b). A linear
relationship with an intercept of 50 MPa and a
slope equal to a coefficient of friction of about 0.6
fits much of the data (excluding materials such as
montmorillonite, vermiculite, and illite). For
normal traction magnitudes greater than a few
hundred MPa, the coefficient of friction is essentially equal to the static friction (9.31).
The frictional behavior of most rocks in the
ranges of normal traction specified in Fig. 9.17a and
b can be characterized as follows (Byerlee, 1978):
(9.32)
Ϫ100 Ն t n Ն Ϫ2000 MPa
|t s | ϭ 50 MPa Ϫ 0.6t n ,
|t s | ϭ Ϫ0.85t n , Ϫ5 Ն t n Ն Ϫ100 MPa
9.2 STRENGTH OF LABORATORY SAMPLES
353
Table 9.5. Frictional strength and coefficient of
friction.
Rock type
S f (MPa)
c
Marble
1.10
0.75
Trachyte
0.41
0.68
Gabbro
0.38
0.66
Granite
0.31
0.64
Sandstone
0.28
0.51
and the behavior is believed to be representative
of many rock types ( Jaeger and Cook, 1979). Note
that the intercept on the shear traction axis is not
zero for any of the data sets, so a more general
linear relationship than (9.29) is required:
(9.30)
The intercept on the ordinate, S f , is the frictional
strength in the absence of any normal traction and
the slope c is the coefficient of friction. This linear
relationship is identical in form to Coulomb’s criterion for the shear strength of intact solids which
is described later in this chapter (9.38). The
Coulomb criterion applies to the interior of a continuous solid rather than to discrete surfaces in
frictional contact. The mathematical similarity of
these equations should not obscure the fact that
the former describes a friction experiment where
sliding is induced along two surfaces in contact,
whereas the latter describes the initiation of a
shear fracture in an otherwise unbroken solid.
Laboratory experiments also have demonstrated
that friction is dependent upon the velocity of
sliding and the time of contact (Dieterich, 1979a,
b, 1981; Kilgore et al., 1993).
Given data that define the linear relationship
(9.30), the static friction, s , is derived from the
frictional strength and coefficient of friction as
follows:
(9.31)
For values of the normal traction less than or comparable to the frictional strength, the first term on
the right-hand side makes a significant contribution to the static friction. Under these conditions
it is not appropriate to equate the coefficient of
friction and the static friction. If the normal traction is much greater than the frictional strength,
the first term becomes insignificant and the
coefficient of friction approaches the value of the
static friction. Some laboratory values for the frictional strength and the coefficient of friction
from (9.30) are reported in Table 9.5.
Laboratory data on the friction of rock surfaces
may be categorized into three broad classes based
t n Յ 0 (sliding initiates)
s ϭ
|t s |
Ϫt n
ϭ
S f
Ϫt n
ϩ c ,
|t s | ϭ S f Ϫ c t n , t n Յ 0 (sliding initiates)
on the magnitude of the normal traction acting on
the sliding surface (Byerlee, 1978). The first class
includes normal traction conditions to Ϫ5 MPa and
would therefore relate to very shallow conditions
in the Earth, typically less than a few hundred
meters depth. This is the environment of the engineering geologist and civil engineer (Barton, 1973).
At moderate normal tractions, from Ϫ5 to
Ϫ100 MPa, many laboratory results for maximum
friction (point B on Fig. 9.15c) plot close to a line
with zero intercept and a slope equal to a static friction of 0.85 (Fig. 9.17a). Rock types include sandstone, graywacke, limestone, quartzite, gneiss,
granite, granodiorite, and gabbro. These results are
applicable to underground excavations, well-bore
problems, and sliding on faults down to about 4 km
depth. Apparently the friction is not highly dependent on lithology (with a few exceptions), nor is it
particularly dependent on the roughness of the
sliding surfaces. The data set for maximum friction
in the range from Ϫ100 MPa up to about
Ϫ1500 MPa is applicable to sliding on faults at
depths from 4 to perhaps 60 km (Fig. 9.17b). A linear
relationship with an intercept of 50 MPa and a
slope equal to a coefficient of friction of about 0.6
fits much of the data (excluding materials such as
montmorillonite, vermiculite, and illite). For
normal traction magnitudes greater than a few
hundred MPa, the coefficient of friction is essentially equal to the static friction (9.31).
The frictional behavior of most rocks in the
ranges of normal traction specified in Fig. 9.17a and
b can be characterized as follows (Byerlee, 1978):
(9.32)
Ϫ100 Ն t n Ն Ϫ2000 MPa
|t s | ϭ 50 MPa Ϫ 0.6t n ,
|t s | ϭ Ϫ0.85t n , Ϫ5 Ն t n Ն Ϫ100 MPa
9.2 STRENGTH OF LABORATORY SAMPLES
353
Table 9.5. Frictional strength and coefficient of
friction.
Rock type
S f (MPa)
c
Marble
1.10
0.75
Trachyte
0.41
0.68
Gabbro
0.38
0.66
Granite
0.31
0.64
Sandstone
0.28
0.51