

force (path OABC). On the other hand, stick slip
behavior involves the sudden acceleration of the
slider with concurrent drop in the spring force.
Eventually the force recovers and such events may
be repeated many times during a single experiment (path OABDE, etc.). This behavior has been
suggested as the laboratory counterpart of the
mechanism responsible for earthquakes (Brace
and Byerlee, 1966).
The actual configuration of specimen and
testing machine for laboratory friction experiments is quite variable (Jaeger and Cook, 1979):
some are not much more sophisticated than the
conceptual model of a slider on a surface (Fig.
9.15b). A common design utilizes the standard triaxial test with a diagonal saw cut across cylindrical specimens (Fig. 9.11). Another design involves
pushing a block of rock between two adjacent
blocks (Fig. 9.4b), and still another (Tullis and
Tullis, 1986; Tullis, 1988) employs the counterrotation of two hollow cylinders. Reported values
of the static friction do not vary widely. In Table
9.4 a few representative values are recorded
(Jaeger and Cook, 1979).
The rule of thumb we take from these data is
that values of the static friction for common rock
types typically range from about 0.5 to 0.8, with
0.6 being a good general estimate. Apparently
there is some ambiguity in the reported values of
the static friction because some researchers use
the force required to initiate sliding (point A, Fig.
9.15c), others use the greatest value (point B), and
still others use the value after a stable sliding at a
constant velocity is achieved (point C). For the case
of sliding at a constant velocity a second value of
friction usually is defined as:
(9.28)
Here d is the dynamic friction. The dynamic friction typically is less than the static friction.
Although static friction, s , is fundamentally
defined in terms of the applied forces (9.26), one
may divide through by the apparent contact area
and write a comparable relationship for the static
friction in terms of the shear traction, t s , and
normal traction, t n , acting on the surfaces:
(9.29)
The absolute value is used on the left-hand side
because the relationship should not depend upon
the arbitrary sign of the shear traction. Recall that
a positive normal traction pulls on the surface,
whereas a negative traction pushes against it. The
normal traction must be zero or negative to insure
that the two surfaces stay in contact.
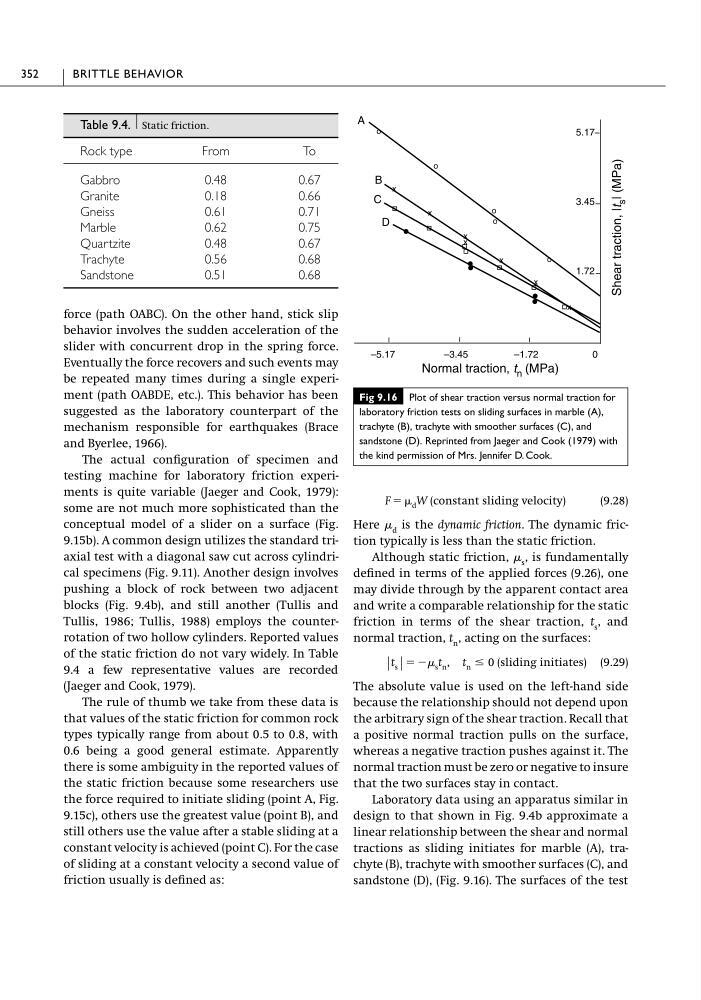
Laboratory data using an apparatus similar in
design to that shown in Fig. 9.4b approximate a
linear relationship between the shear and normal
tractions as sliding initiates for marble (A), trachyte (B), trachyte with smoother surfaces (C), and
sandstone (D), (Fig. 9.16). The surfaces of the test
|t s | ϭ Ϫ s t n , t n Յ 0 (sliding initiates)
F ϭ d W (constant sliding velocity)
352
BRITTLE BEHAVIOR
Table 9.4. Static friction.
Rock type
From
To
Gabbro
0.48
0.67
Granite
0.18
0.66
Gneiss
0.61
0.71
Marble
0.62
0.75
Quartzite
0.48
0.67
Trachyte
0.56
0.68
Sandstone
0.51
0.68
Fig 9.16 Plot of shear traction versus normal traction for
laboratory friction tests on sliding surfaces in marble (A),
trachyte (B), trachyte with smoother surfaces (C), and
sandstone (D). Reprinted from Jaeger and Cook (1979) with
the kind permission of Mrs. Jennifer D. Cook.
5.17
3.45
1.72
Shear traction, |t
s | (MPa)
Normal traction, t n (MPa)
A
B
C
D
–5.17
–3.45
–1.72
0
o
o
o
o
o
x
x
x
x
x
x
x
behavior involves the sudden acceleration of the
slider with concurrent drop in the spring force.
Eventually the force recovers and such events may
be repeated many times during a single experiment (path OABDE, etc.). This behavior has been
suggested as the laboratory counterpart of the
mechanism responsible for earthquakes (Brace
and Byerlee, 1966).
The actual configuration of specimen and
testing machine for laboratory friction experiments is quite variable (Jaeger and Cook, 1979):
some are not much more sophisticated than the
conceptual model of a slider on a surface (Fig.
9.15b). A common design utilizes the standard triaxial test with a diagonal saw cut across cylindrical specimens (Fig. 9.11). Another design involves
pushing a block of rock between two adjacent
blocks (Fig. 9.4b), and still another (Tullis and
Tullis, 1986; Tullis, 1988) employs the counterrotation of two hollow cylinders. Reported values
of the static friction do not vary widely. In Table
9.4 a few representative values are recorded
(Jaeger and Cook, 1979).
The rule of thumb we take from these data is
that values of the static friction for common rock
types typically range from about 0.5 to 0.8, with
0.6 being a good general estimate. Apparently
there is some ambiguity in the reported values of
the static friction because some researchers use
the force required to initiate sliding (point A, Fig.
9.15c), others use the greatest value (point B), and
still others use the value after a stable sliding at a
constant velocity is achieved (point C). For the case
of sliding at a constant velocity a second value of
friction usually is defined as:
(9.28)
Here d is the dynamic friction. The dynamic friction typically is less than the static friction.
Although static friction, s , is fundamentally
defined in terms of the applied forces (9.26), one
may divide through by the apparent contact area
and write a comparable relationship for the static
friction in terms of the shear traction, t s , and
normal traction, t n , acting on the surfaces:
(9.29)
The absolute value is used on the left-hand side
because the relationship should not depend upon
the arbitrary sign of the shear traction. Recall that
a positive normal traction pulls on the surface,
whereas a negative traction pushes against it. The
normal traction must be zero or negative to insure
that the two surfaces stay in contact.
Laboratory data using an apparatus similar in
design to that shown in Fig. 9.4b approximate a
linear relationship between the shear and normal
tractions as sliding initiates for marble (A), trachyte (B), trachyte with smoother surfaces (C), and
sandstone (D), (Fig. 9.16). The surfaces of the test
|t s | ϭ Ϫ s t n , t n Յ 0 (sliding initiates)
F ϭ d W (constant sliding velocity)
352
BRITTLE BEHAVIOR
Table 9.4. Static friction.
Rock type
From
To
Gabbro
0.48
0.67
Granite
0.18
0.66
Gneiss
0.61
0.71
Marble
0.62
0.75
Quartzite
0.48
0.67
Trachyte
0.56
0.68
Sandstone
0.51
0.68
Fig 9.16 Plot of shear traction versus normal traction for
laboratory friction tests on sliding surfaces in marble (A),
trachyte (B), trachyte with smoother surfaces (C), and
sandstone (D). Reprinted from Jaeger and Cook (1979) with
the kind permission of Mrs. Jennifer D. Cook.
5.17
3.45
1.72
Shear traction, |t
s | (MPa)
Normal traction, t n (MPa)
A
B
C
D
–5.17
–3.45
–1.72
0
o
o
o
o
o
x
x
x
x
x
x
x