

(negative) at depth. There, the normal stress components act inward on the boundaries of a representative element of porous rock, whereas the fluid
pressure pushes outward in all directions from
within the pores. In this way the pore pressure
serves to counterbalance the compressive stress.
Since the pore pressure acts equally in all directions
it does not influence the shear stress components.
Two experimental observations, carried out
using triaxial testing procedures, led Terzaghi to
the concept of effective stress. When the axial and
radial stress are of equal magnitude, the sample is
subjected to an externally imposed isotropic state
of stress, a ϭ r ϭϪP c . As this isotropic state of
stress changes, the volume of the sample changes.
On the other hand if the pore pressure is
increased in magnitude at the same rate as this
isotropic stress so P c ϭP p , Terzaghi noted that the
volume of the sample did not change appreciably.
Thus, the volume change is related to the effective
confining pressure, P c ϪP p .
The second observation of Terzaghi was that
the strength of laboratory samples increased
significantly with confining pressure, but did not
increase appreciably if the pore pressure was
increased in concert with the confining pressure.
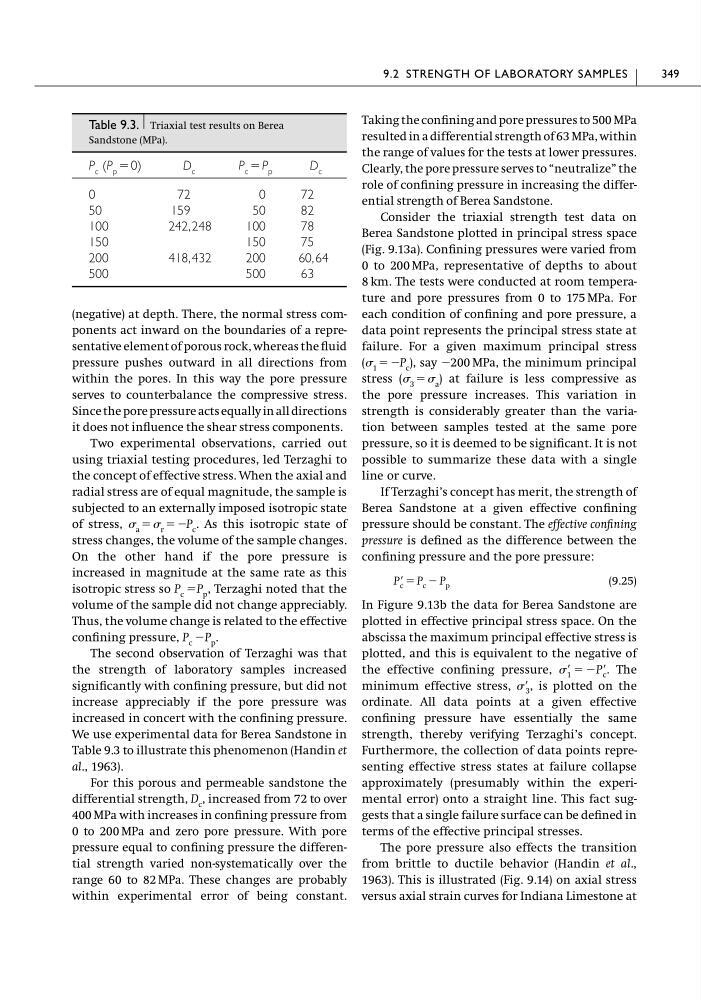
We use experimental data for Berea Sandstone in
Table 9.3 to illustrate this phenomenon (Handin et
al., 1963).
For this porous and permeable sandstone the
differential strength, D c , increased from 72 to over
400 MPa with increases in confining pressure from
0 to 200 MPa and zero pore pressure. With pore
pressure equal to confining pressure the differential strength varied non-systematically over the
range 60 to 82 MPa. These changes are probably
within experimental error of being constant.
Taking the confining and pore pressures to 500 MPa
resulted in a differential strength of 63 MPa, within
the range of values for the tests at lower pressures.
Clearly, the pore pressure serves to “neutralize” the
role of confining pressure in increasing the differential strength of Berea Sandstone.
Consider the triaxial strength test data on
Berea Sandstone plotted in principal stress space
(Fig. 9.13a). Confining pressures were varied from
0 to 200 MPa, representative of depths to about
8 km. The tests were conducted at room temperature and pore pressures from 0 to 175 MPa. For
each condition of confining and pore pressure, a
data point represents the principal stress state at
failure. For a given maximum principal stress
( 1 ϭϪP c ), say Ϫ200 MPa, the minimum principal
stress ( 3 ϭ a ) at failure is less compressive as
the pore pressure increases. This variation in
strength is considerably greater than the variation between samples tested at the same pore
pressure, so it is deemed to be significant. It is not
possible to summarize these data with a single
line or curve.
If Terzaghi’s concept has merit, the strength of
Berea Sandstone at a given effective confining
pressure should be constant. The effective confining
pressure is defined as the difference between the
confining pressure and the pore pressure:
(9.25)
In Figure 9.13b the data for Berea Sandstone are
plotted in effective principal stress space. On the
abscissa the maximum principal effective stress is
plotted, and this is equivalent to the negative of
the effective confining pressure,
The
minimum effective stress,
is plotted on the
ordinate. All data points at a given effective
confining pressure have essentially the same
strength, thereby verifying Terzaghi’s concept.
Furthermore, the collection of data points representing effective stress states at failure collapse
approximately (presumably within the experimental error) onto a straight line. This fact suggests that a single failure surface can be defined in
terms of the effective principal stresses.
The pore pressure also effects the transition
from brittle to ductile behavior (Handin et al.,
1963). This is illustrated (Fig. 9.14) on axial stress
versus axial strain curves for Indiana Limestone at
Ј 3 ,
Ј 1 ϭ ϪPЈ c .
PЈ c ϭ P c Ϫ P p
9.2 STRENGTH OF LABORATORY SAMPLES
349
Table 9.3. Triaxial test results on Berea
Sandstone (MPa).
P c (P p ϭ 0)
D c
P c ϭP p
D c
0
72
0
72
50
159
50
82
100
242,248
100
78
150
150
75
200
418,432
200
60,64
500
500
63
pressure pushes outward in all directions from
within the pores. In this way the pore pressure
serves to counterbalance the compressive stress.
Since the pore pressure acts equally in all directions
it does not influence the shear stress components.
Two experimental observations, carried out
using triaxial testing procedures, led Terzaghi to
the concept of effective stress. When the axial and
radial stress are of equal magnitude, the sample is
subjected to an externally imposed isotropic state
of stress, a ϭ r ϭϪP c . As this isotropic state of
stress changes, the volume of the sample changes.
On the other hand if the pore pressure is
increased in magnitude at the same rate as this
isotropic stress so P c ϭP p , Terzaghi noted that the
volume of the sample did not change appreciably.
Thus, the volume change is related to the effective
confining pressure, P c ϪP p .
The second observation of Terzaghi was that
the strength of laboratory samples increased
significantly with confining pressure, but did not
increase appreciably if the pore pressure was
increased in concert with the confining pressure.
We use experimental data for Berea Sandstone in
Table 9.3 to illustrate this phenomenon (Handin et
al., 1963).
For this porous and permeable sandstone the
differential strength, D c , increased from 72 to over
400 MPa with increases in confining pressure from
0 to 200 MPa and zero pore pressure. With pore
pressure equal to confining pressure the differential strength varied non-systematically over the
range 60 to 82 MPa. These changes are probably
within experimental error of being constant.
Taking the confining and pore pressures to 500 MPa
resulted in a differential strength of 63 MPa, within
the range of values for the tests at lower pressures.
Clearly, the pore pressure serves to “neutralize” the
role of confining pressure in increasing the differential strength of Berea Sandstone.
Consider the triaxial strength test data on
Berea Sandstone plotted in principal stress space
(Fig. 9.13a). Confining pressures were varied from
0 to 200 MPa, representative of depths to about
8 km. The tests were conducted at room temperature and pore pressures from 0 to 175 MPa. For
each condition of confining and pore pressure, a
data point represents the principal stress state at
failure. For a given maximum principal stress
( 1 ϭϪP c ), say Ϫ200 MPa, the minimum principal
stress ( 3 ϭ a ) at failure is less compressive as
the pore pressure increases. This variation in
strength is considerably greater than the variation between samples tested at the same pore
pressure, so it is deemed to be significant. It is not
possible to summarize these data with a single
line or curve.
If Terzaghi’s concept has merit, the strength of
Berea Sandstone at a given effective confining
pressure should be constant. The effective confining
pressure is defined as the difference between the
confining pressure and the pore pressure:
(9.25)
In Figure 9.13b the data for Berea Sandstone are
plotted in effective principal stress space. On the
abscissa the maximum principal effective stress is
plotted, and this is equivalent to the negative of
the effective confining pressure,
The
minimum effective stress,
is plotted on the
ordinate. All data points at a given effective
confining pressure have essentially the same
strength, thereby verifying Terzaghi’s concept.
Furthermore, the collection of data points representing effective stress states at failure collapse
approximately (presumably within the experimental error) onto a straight line. This fact suggests that a single failure surface can be defined in
terms of the effective principal stresses.
The pore pressure also effects the transition
from brittle to ductile behavior (Handin et al.,
1963). This is illustrated (Fig. 9.14) on axial stress
versus axial strain curves for Indiana Limestone at
Ј 3 ,
Ј 1 ϭ ϪPЈ c .
PЈ c ϭ P c Ϫ P p
9.2 STRENGTH OF LABORATORY SAMPLES
349
Table 9.3. Triaxial test results on Berea
Sandstone (MPa).
P c (P p ϭ 0)
D c
P c ϭP p
D c
0
72
0
72
50
159
50
82
100
242,248
100
78
150
150
75
200
418,432
200
60,64
500
500
63