

ratio for all of the rock types listed vary only from
0.08 to 0.40. We develop the following rule of
thumb from these data: laboratory specimens of rock
have Poisson’s ratios that range from about 0.1 to 0.4
with a “typical” value of about 0.25.
8.5.3 Elastic properties of rock from
engineering field tests
In light of the heterogeneous nature of rock
masses as observed at laboratory, outcrop, and
crustal scales, it seems natural to suspect that
physical properties, such as the elastic moduli,
would be length-scale dependent (Pinto da Cunha,
1990). Rock engineers have developed methods to
estimate the in-situ properties of rock masses
around underground openings and beneath large
engineering structures like dams, and these
tests provide valuable insight about the scale
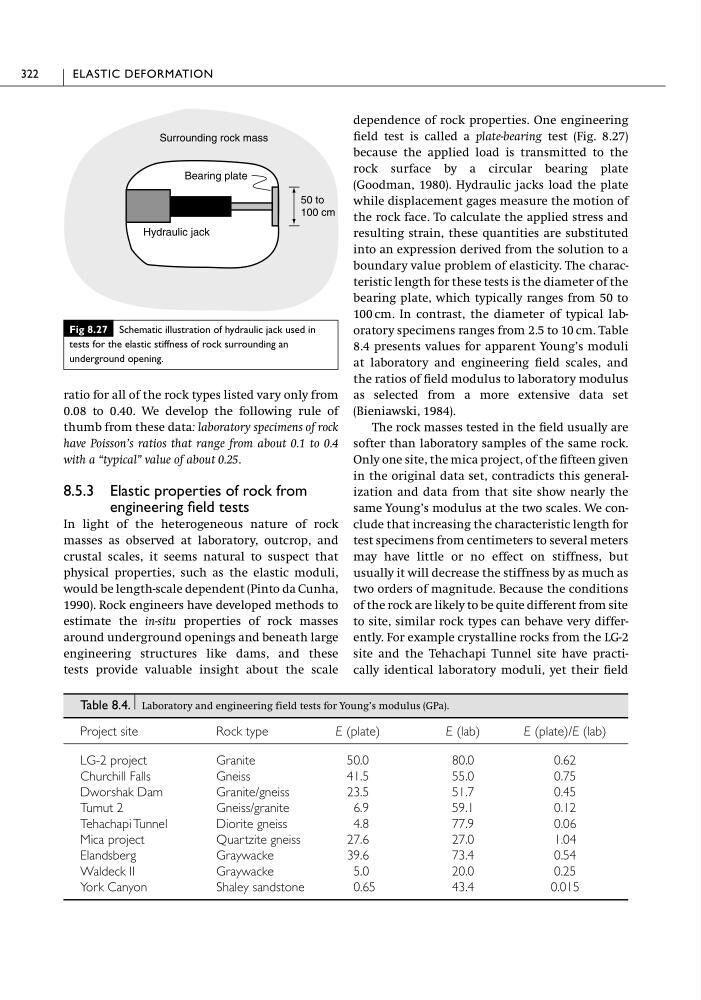
dependence of rock properties. One engineering
field test is called a plate-bearing test (Fig. 8.27)
because the applied load is transmitted to the
rock surface by a circular bearing plate
(Goodman, 1980). Hydraulic jacks load the plate
while displacement gages measure the motion of
the rock face. To calculate the applied stress and
resulting strain, these quantities are substituted
into an expression derived from the solution to a
boundary value problem of elasticity. The characteristic length for these tests is the diameter of the
bearing plate, which typically ranges from 50 to
100 cm. In contrast, the diameter of typical laboratory specimens ranges from 2.5 to 10 cm. Table
8.4 presents values for apparent Young’s moduli
at laboratory and engineering field scales, and
the ratios of field modulus to laboratory modulus
as selected from a more extensive data set
(Bieniawski, 1984).
The rock masses tested in the field usually are
softer than laboratory samples of the same rock.
Only one site, the mica project, of the fifteen given
in the original data set, contradicts this generalization and data from that site show nearly the
same Young’s modulus at the two scales. We conclude that increasing the characteristic length for
test specimens from centimeters to several meters
may have little or no effect on stiffness, but
usually it will decrease the stiffness by as much as
two orders of magnitude. Because the conditions
of the rock are likely to be quite different from site
to site, similar rock types can behave very differently. For example crystalline rocks from the LG-2
site and the Tehachapi Tunnel site have practically identical laboratory moduli, yet their field
322
ELASTIC DEFORMATION
Fig 8.27 Schematic illustration of hydraulic jack used in
tests for the elastic stiffness of rock surrounding an
underground opening.
Bearing plate
Hydraulic jack
50 to
100 cm
Surrounding rock mass
Table 8.4. Laboratory and engineering field tests for Young’s modulus (GPa).
Project site
Rock type
E (plate)
E (lab)
E (plate)/E (lab)
LG-2 project
Granite
50.0
80.0
0.62
Churchill Falls
Gneiss
41.5
55.0
0.75
Dworshak Dam
Granite/gneiss
23.5
51.7
0.45
Tumut 2
Gneiss/granite
6.9
59.1
0.12
Tehachapi Tunnel
Diorite gneiss
4.8
77.9
0.06
Mica project
Quartzite gneiss
27.6
27.0
1.04
Elandsberg
Graywacke
39.6
73.4
0.54
Waldeck II
Graywacke
5.0
20.0
0.25
York Canyon
Shaley sandstone
0.65
43.4
0.015
0.08 to 0.40. We develop the following rule of
thumb from these data: laboratory specimens of rock
have Poisson’s ratios that range from about 0.1 to 0.4
with a “typical” value of about 0.25.
8.5.3 Elastic properties of rock from
engineering field tests
In light of the heterogeneous nature of rock
masses as observed at laboratory, outcrop, and
crustal scales, it seems natural to suspect that
physical properties, such as the elastic moduli,
would be length-scale dependent (Pinto da Cunha,
1990). Rock engineers have developed methods to
estimate the in-situ properties of rock masses
around underground openings and beneath large
engineering structures like dams, and these
tests provide valuable insight about the scale
dependence of rock properties. One engineering
field test is called a plate-bearing test (Fig. 8.27)
because the applied load is transmitted to the
rock surface by a circular bearing plate
(Goodman, 1980). Hydraulic jacks load the plate
while displacement gages measure the motion of
the rock face. To calculate the applied stress and
resulting strain, these quantities are substituted
into an expression derived from the solution to a
boundary value problem of elasticity. The characteristic length for these tests is the diameter of the
bearing plate, which typically ranges from 50 to
100 cm. In contrast, the diameter of typical laboratory specimens ranges from 2.5 to 10 cm. Table
8.4 presents values for apparent Young’s moduli
at laboratory and engineering field scales, and
the ratios of field modulus to laboratory modulus
as selected from a more extensive data set
(Bieniawski, 1984).
The rock masses tested in the field usually are
softer than laboratory samples of the same rock.
Only one site, the mica project, of the fifteen given
in the original data set, contradicts this generalization and data from that site show nearly the
same Young’s modulus at the two scales. We conclude that increasing the characteristic length for
test specimens from centimeters to several meters
may have little or no effect on stiffness, but
usually it will decrease the stiffness by as much as
two orders of magnitude. Because the conditions
of the rock are likely to be quite different from site
to site, similar rock types can behave very differently. For example crystalline rocks from the LG-2
site and the Tehachapi Tunnel site have practically identical laboratory moduli, yet their field
322
ELASTIC DEFORMATION
Fig 8.27 Schematic illustration of hydraulic jack used in
tests for the elastic stiffness of rock surrounding an
underground opening.
Bearing plate
Hydraulic jack
50 to
100 cm
Surrounding rock mass
Table 8.4. Laboratory and engineering field tests for Young’s modulus (GPa).
Project site
Rock type
E (plate)
E (lab)
E (plate)/E (lab)
LG-2 project
Granite
50.0
80.0
0.62
Churchill Falls
Gneiss
41.5
55.0
0.75
Dworshak Dam
Granite/gneiss
23.5
51.7
0.45
Tumut 2
Gneiss/granite
6.9
59.1
0.12
Tehachapi Tunnel
Diorite gneiss
4.8
77.9
0.06
Mica project
Quartzite gneiss
27.6
27.0
1.04
Elandsberg
Graywacke
39.6
73.4
0.54
Waldeck II
Graywacke
5.0
20.0
0.25
York Canyon
Shaley sandstone
0.65
43.4
0.015