

specimen ends are not perfectly parallel, bending
can be induced. Also, depending on differences in
the elastic properties of the platen and specimen,
and on the friction at their contacts, the specimen
may be constrained by the platens or pushed radially outward as the platens expand under load.
Both of these phenomena are accompanied by a
non-uniform stress state on the scale of the entire
specimen. To understand the possible severity and
consequences of this non-uniformity, the state of
stress can be calculated using a boundary value
problem for a cylindrical body with the appropriate tractions or displacements on the ends (Peng,
1971). The hemispherical cap and seat (Fig. 8.25a),
special platen material, and other standard
testing procedures are designed to minimize the
specimen-scale non-uniformities in the stress
field. At the grain scale the stress and strain fields
are likely to be very non-uniform. The presumption is that the stress and strain represent average
values over the volume of the sample. Because of
the difficulties inherent to the testing procedure
we will refer to laboratory results as apparent
Young’s moduli.
An electronic strain gage can be glued onto the
specimen to determine the axial extension (Fig.
8.25b). These gages are composed of thin wires
that undergo a change in electrical resistance as
they are stretched or shortened along with the
specimen. This change in resistance is transformed into an electronic signal calibrated to the
extension magnitude and read onto a digital
display, chart recorder, or computer storage
device. Thus electrical resistance change is measured and axial extension is estimated from this
measurement via a calibration of the strain gage.
The gage must be large compared to the grain size
to measure an average extension. Alternatively,
mechanical dial gages or electronic displacement
transducers can be attached to the specimen or
platens to measure the changes in length that,
with the original length, are used to calculate the
axial extension.
A force transducer placed between the piston
and the specimen measures the normal force
acting on the specimen (Fig. 8.25a). In fact, most
force transducers use a strain gage to measure the
extension of a small metal part within the transducer and then transform this into an electronic
signal calibrated to the force magnitude. The
cross-sectional area of the specimen is calculated
from a measurement of the diameter and this is
used to calculate the axial stress, which is
assumed to represent the average stress throughout the specimen. Neither the stress nor the strain
are measured directly.
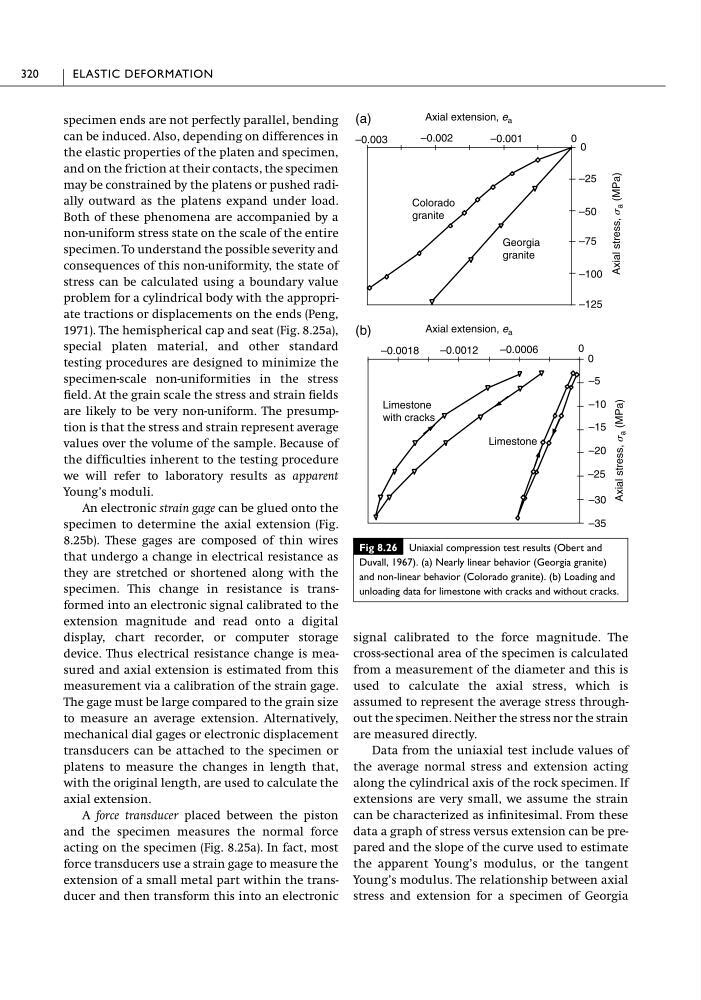
Data from the uniaxial test include values of
the average normal stress and extension acting
along the cylindrical axis of the rock specimen. If
extensions are very small, we assume the strain
can be characterized as infinitesimal. From these
data a graph of stress versus extension can be prepared and the slope of the curve used to estimate
the apparent Young’s modulus, or the tangent
Young’s modulus. The relationship between axial
stress and extension for a specimen of Georgia
320
ELASTIC DEFORMATION
Fig 8.26 Uniaxial compression test results (Obert and
Duvall, 1967). (a) Nearly linear behavior (Georgia granite)
and non-linear behavior (Colorado granite). (b) Loading and
unloading data for limestone with cracks and without cracks.
Axial extension, e a
0
–25
–50
–75
–100
–125
0
–0.001
–0.002
–0.003
Georgia
granite
Colorado
granite
0
–5
–10
–15
–20
–25
–30
–35
0
–0.0006
–0.0012
–0.0018
Limestone
Limestone
with cracks
Axial extension, e a
(a)
(b)
Axial stress, s
a (MPa)
Axial stress, s
a (MPa)
can be induced. Also, depending on differences in
the elastic properties of the platen and specimen,
and on the friction at their contacts, the specimen
may be constrained by the platens or pushed radially outward as the platens expand under load.
Both of these phenomena are accompanied by a
non-uniform stress state on the scale of the entire
specimen. To understand the possible severity and
consequences of this non-uniformity, the state of
stress can be calculated using a boundary value
problem for a cylindrical body with the appropriate tractions or displacements on the ends (Peng,
1971). The hemispherical cap and seat (Fig. 8.25a),
special platen material, and other standard
testing procedures are designed to minimize the
specimen-scale non-uniformities in the stress
field. At the grain scale the stress and strain fields
are likely to be very non-uniform. The presumption is that the stress and strain represent average
values over the volume of the sample. Because of
the difficulties inherent to the testing procedure
we will refer to laboratory results as apparent
Young’s moduli.
An electronic strain gage can be glued onto the
specimen to determine the axial extension (Fig.
8.25b). These gages are composed of thin wires
that undergo a change in electrical resistance as
they are stretched or shortened along with the
specimen. This change in resistance is transformed into an electronic signal calibrated to the
extension magnitude and read onto a digital
display, chart recorder, or computer storage
device. Thus electrical resistance change is measured and axial extension is estimated from this
measurement via a calibration of the strain gage.
The gage must be large compared to the grain size
to measure an average extension. Alternatively,
mechanical dial gages or electronic displacement
transducers can be attached to the specimen or
platens to measure the changes in length that,
with the original length, are used to calculate the
axial extension.
A force transducer placed between the piston
and the specimen measures the normal force
acting on the specimen (Fig. 8.25a). In fact, most
force transducers use a strain gage to measure the
extension of a small metal part within the transducer and then transform this into an electronic
signal calibrated to the force magnitude. The
cross-sectional area of the specimen is calculated
from a measurement of the diameter and this is
used to calculate the axial stress, which is
assumed to represent the average stress throughout the specimen. Neither the stress nor the strain
are measured directly.
Data from the uniaxial test include values of
the average normal stress and extension acting
along the cylindrical axis of the rock specimen. If
extensions are very small, we assume the strain
can be characterized as infinitesimal. From these
data a graph of stress versus extension can be prepared and the slope of the curve used to estimate
the apparent Young’s modulus, or the tangent
Young’s modulus. The relationship between axial
stress and extension for a specimen of Georgia
320
ELASTIC DEFORMATION
Fig 8.26 Uniaxial compression test results (Obert and
Duvall, 1967). (a) Nearly linear behavior (Georgia granite)
and non-linear behavior (Colorado granite). (b) Loading and
unloading data for limestone with cracks and without cracks.
Axial extension, e a
0
–25
–50
–75
–100
–125
0
–0.001
–0.002
–0.003
Georgia
granite
Colorado
granite
0
–5
–10
–15
–20
–25
–30
–35
0
–0.0006
–0.0012
–0.0018
Limestone
Limestone
with cracks
Axial extension, e a
(a)
(b)
Axial stress, s
a (MPa)
Axial stress, s
a (MPa)