

within the crust so these pairings of edge dislocations become models for thrust and normal faults
as well.
8.3.3 A compelling example of elastic
deformation: the Hector Mine
earthquake
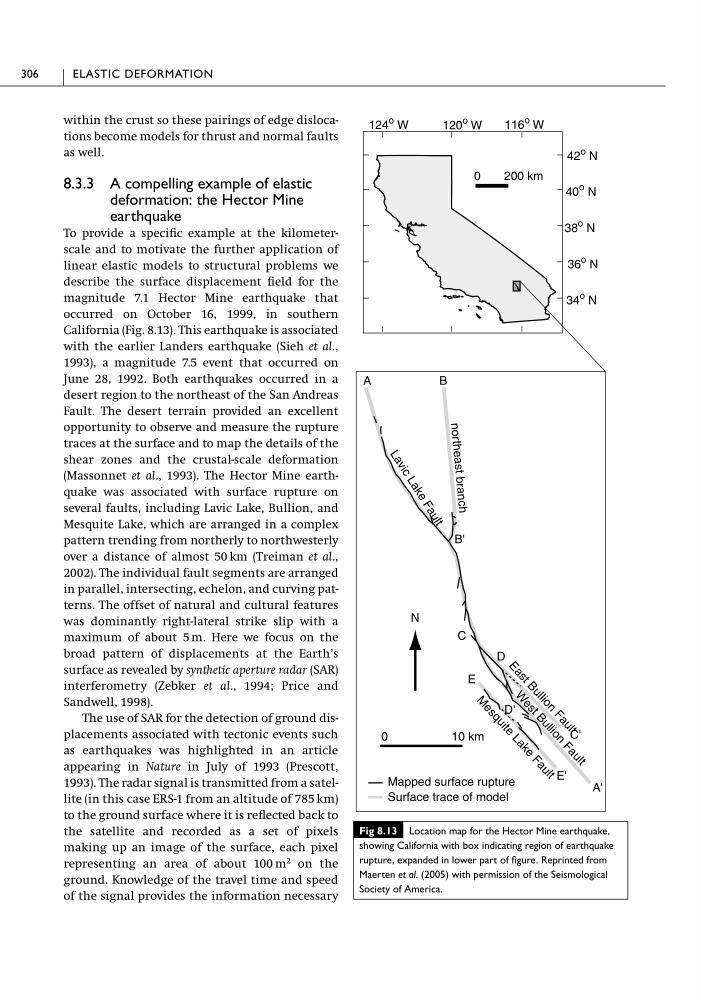
To provide a specific example at the kilometerscale and to motivate the further application of
linear elastic models to structural problems we
describe the surface displacement field for the
magnitude 7.1 Hector Mine earthquake that
occurred on October 16, 1999, in southern
California (Fig. 8.13). This earthquake is associated
with the earlier Landers earthquake (Sieh et al.,
1993), a magnitude 7.5 event that occurred on
June 28, 1992. Both earthquakes occurred in a
desert region to the northeast of the San Andreas
Fault. The desert terrain provided an excellent
opportunity to observe and measure the rupture
traces at the surface and to map the details of the
shear zones and the crustal-scale deformation
(Massonnet et al., 1993). The Hector Mine earthquake was associated with surface rupture on
several faults, including Lavic Lake, Bullion, and
Mesquite Lake, which are arranged in a complex
pattern trending from northerly to northwesterly
over a distance of almost 50 km (Treiman et al.,
2002). The individual fault segments are arranged
in parallel, intersecting, echelon, and curving patterns. The offset of natural and cultural features
was dominantly right-lateral strike slip with a
maximum of about 5 m. Here we focus on the
broad pattern of displacements at the Earth’s
surface as revealed by synthetic aperture radar (SAR)
interferometry (Zebker et al., 1994; Price and
Sandwell, 1998).
The use of SAR for the detection of ground displacements associated with tectonic events such
as earthquakes was highlighted in an article
appearing in Nature in July of 1993 (Prescott,
1993). The radar signal is transmitted from a satellite (in this case ERS-1 from an altitude of 785 km)
to the ground surface where it is reflected back to
the satellite and recorded as a set of pixels
making up an image of the surface, each pixel
representing an area of about 100 m
2 on the
ground. Knowledge of the travel time and speed
of the signal provides the information necessary
306
ELASTIC DEFORMATION
Fig 8.13 Location map for the Hector Mine earthquake,
showing California with box indicating region of earthquake
rupture, expanded in lower part of figure. Reprinted from
Maerten et al. (2005) with permission of the Seismological
Society of America.
N
0
10 km
Mapped surface rupture
Surface trace of model
L
a
v
i
c
L
a
k
e
F
a
u
l
t
nor the
ast
bra
nch
E
a
s
t
B
u
l
l
i
o
n
F
a
u
l
t
W
e
s
t
B
u
l
l
i
o
n
F
a
u
l
t
M
e
s
q
u
i
t
e
L
a
k
e
F
a
u
l
t
A
A'
B
B'
C
C'
D
D'
E
E'
124
o W
116
o W
36
o N
34
o N
40
o N
42
o N
0
200 km
120
o W
38
o N
as well.
8.3.3 A compelling example of elastic
deformation: the Hector Mine
earthquake
To provide a specific example at the kilometerscale and to motivate the further application of
linear elastic models to structural problems we
describe the surface displacement field for the
magnitude 7.1 Hector Mine earthquake that
occurred on October 16, 1999, in southern
California (Fig. 8.13). This earthquake is associated
with the earlier Landers earthquake (Sieh et al.,
1993), a magnitude 7.5 event that occurred on
June 28, 1992. Both earthquakes occurred in a
desert region to the northeast of the San Andreas
Fault. The desert terrain provided an excellent
opportunity to observe and measure the rupture
traces at the surface and to map the details of the
shear zones and the crustal-scale deformation
(Massonnet et al., 1993). The Hector Mine earthquake was associated with surface rupture on
several faults, including Lavic Lake, Bullion, and
Mesquite Lake, which are arranged in a complex
pattern trending from northerly to northwesterly
over a distance of almost 50 km (Treiman et al.,
2002). The individual fault segments are arranged
in parallel, intersecting, echelon, and curving patterns. The offset of natural and cultural features
was dominantly right-lateral strike slip with a
maximum of about 5 m. Here we focus on the
broad pattern of displacements at the Earth’s
surface as revealed by synthetic aperture radar (SAR)
interferometry (Zebker et al., 1994; Price and
Sandwell, 1998).
The use of SAR for the detection of ground displacements associated with tectonic events such
as earthquakes was highlighted in an article
appearing in Nature in July of 1993 (Prescott,
1993). The radar signal is transmitted from a satellite (in this case ERS-1 from an altitude of 785 km)
to the ground surface where it is reflected back to
the satellite and recorded as a set of pixels
making up an image of the surface, each pixel
representing an area of about 100 m
2 on the
ground. Knowledge of the travel time and speed
of the signal provides the information necessary
306
ELASTIC DEFORMATION
Fig 8.13 Location map for the Hector Mine earthquake,
showing California with box indicating region of earthquake
rupture, expanded in lower part of figure. Reprinted from
Maerten et al. (2005) with permission of the Seismological
Society of America.
N
0
10 km
Mapped surface rupture
Surface trace of model
L
a
v
i
c
L
a
k
e
F
a
u
l
t
nor the
ast
bra
nch
E
a
s
t
B
u
l
l
i
o
n
F
a
u
l
t
W
e
s
t
B
u
l
l
i
o
n
F
a
u
l
t
M
e
s
q
u
i
t
e
L
a
k
e
F
a
u
l
t
A
A'
B
B'
C
C'
D
D'
E
E'
124
o W
116
o W
36
o N
34
o N
40
o N
42
o N
0
200 km
120
o W
38
o N