

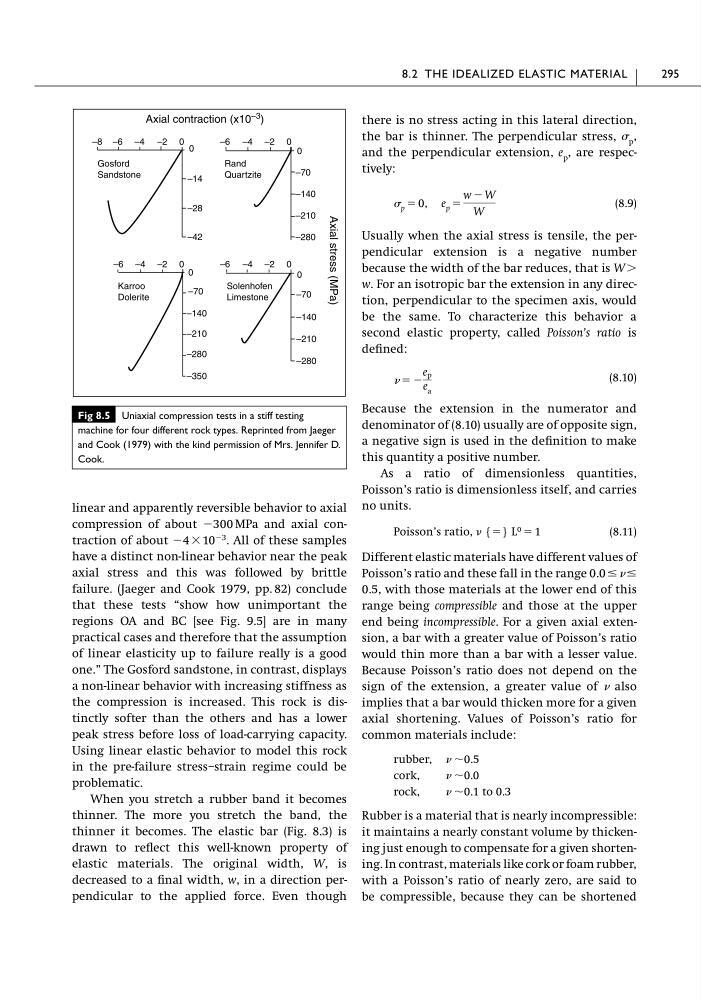
linear and apparently reversible behavior to axial
compression of about Ϫ300 MPa and axial contraction of about Ϫ4 ϫ 10
Ϫ3 . All of these samples
have a distinct non-linear behavior near the peak
axial stress and this was followed by brittle
failure. (Jaeger and Cook 1979, pp. 82) conclude
that these tests “show how unimportant the
regions OA and BC [see Fig. 9.5] are in many
practical cases and therefore that the assumption
of linear elasticity up to failure really is a good
one.” The Gosford sandstone, in contrast, displays
a non-linear behavior with increasing stiffness as
the compression is increased. This rock is distinctly softer than the others and has a lower
peak stress before loss of load-carrying capacity.
Using linear elastic behavior to model this rock
in the pre-failure stress–strain regime could be
problematic.
When you stretch a rubber band it becomes
thinner. The more you stretch the band, the
thinner it becomes. The elastic bar (Fig. 8.3) is
drawn to reflect this well-known property of
elastic materials. The original width, W, is
decreased to a final width, w, in a direction perpendicular to the applied force. Even though
there is no stress acting in this lateral direction,
the bar is thinner. The perpendicular stress, p ,
and the perpendicular extension, e p , are respectively:
(8.9)
Usually when the axial stress is tensile, the perpendicular extension is a negative number
because the width of the bar reduces, that is W Ͼ
w. For an isotropic bar the extension in any direction, perpendicular to the specimen axis, would
be the same. To characterize this behavior a
second elastic property, called Poisson’s ratio is
defined:
(8.10)
Because the extension in the numerator and
denominator of (8.10) usually are of opposite sign,
a negative sign is used in the definition to make
this quantity a positive number.
As a ratio of dimensionless quantities,
Poisson’s ratio is dimensionless itself, and carries
no units.
(8.11)
Different elastic materials have different values of
Poisson’s ratio and these fall in the range 0.0 Յ Յ
0.5, with those materials at the lower end of this
range being compressible and those at the upper
end being incompressible. For a given axial extension, a bar with a greater value of Poisson’s ratio
would thin more than a bar with a lesser value.
Because Poisson’s ratio does not depend on the
sign of the extension, a greater value of also
implies that a bar would thicken more for a given
axial shortening. Values of Poisson’s ratio for
common materials include:
rubber, ϳ0.5
cork,
ϳ0.0
rock,
ϳ0.1 to 0.3
Rubber is a material that is nearly incompressible:
it maintains a nearly constant volume by thickening just enough to compensate for a given shortening. In contrast, materials like cork or foam rubber,
with a Poisson’s ratio of nearly zero, are said to
be compressible, because they can be shortened
Poisson’s ratio, {ϭ} L 0 ϭ 1
ϭ Ϫ
e p
e a
p ϭ 0, e p ϭ
w Ϫ W
W
8.2 THE IDEALIZED ELASTIC MATERIAL
295
Fig 8.5 Uniaxial compression tests in a stiff testing
machine for four different rock types. Reprinted from Jaeger
and Cook (1979) with the kind permission of Mrs. Jennifer D.
Cook.
–8 –6 –4 –2 0 0
–14
–28
–42
–6 –4 –2 0
0
–70
–140
–210
–280
–6 –4 –2 0 0
–70
–140
–210
–280
–350
–6 –4 –2 0
0
–70
–140
–210
–280
Axial stress (MPa)
Solenhofen
Limestone
Karroo
Dolerite
Rand
Quartzite
Gosford
Sandstone
Axial contraction (x10
–3
)
compression of about Ϫ300 MPa and axial contraction of about Ϫ4 ϫ 10
Ϫ3 . All of these samples
have a distinct non-linear behavior near the peak
axial stress and this was followed by brittle
failure. (Jaeger and Cook 1979, pp. 82) conclude
that these tests “show how unimportant the
regions OA and BC [see Fig. 9.5] are in many
practical cases and therefore that the assumption
of linear elasticity up to failure really is a good
one.” The Gosford sandstone, in contrast, displays
a non-linear behavior with increasing stiffness as
the compression is increased. This rock is distinctly softer than the others and has a lower
peak stress before loss of load-carrying capacity.
Using linear elastic behavior to model this rock
in the pre-failure stress–strain regime could be
problematic.
When you stretch a rubber band it becomes
thinner. The more you stretch the band, the
thinner it becomes. The elastic bar (Fig. 8.3) is
drawn to reflect this well-known property of
elastic materials. The original width, W, is
decreased to a final width, w, in a direction perpendicular to the applied force. Even though
there is no stress acting in this lateral direction,
the bar is thinner. The perpendicular stress, p ,
and the perpendicular extension, e p , are respectively:
(8.9)
Usually when the axial stress is tensile, the perpendicular extension is a negative number
because the width of the bar reduces, that is W Ͼ
w. For an isotropic bar the extension in any direction, perpendicular to the specimen axis, would
be the same. To characterize this behavior a
second elastic property, called Poisson’s ratio is
defined:
(8.10)
Because the extension in the numerator and
denominator of (8.10) usually are of opposite sign,
a negative sign is used in the definition to make
this quantity a positive number.
As a ratio of dimensionless quantities,
Poisson’s ratio is dimensionless itself, and carries
no units.
(8.11)
Different elastic materials have different values of
Poisson’s ratio and these fall in the range 0.0 Յ Յ
0.5, with those materials at the lower end of this
range being compressible and those at the upper
end being incompressible. For a given axial extension, a bar with a greater value of Poisson’s ratio
would thin more than a bar with a lesser value.
Because Poisson’s ratio does not depend on the
sign of the extension, a greater value of also
implies that a bar would thicken more for a given
axial shortening. Values of Poisson’s ratio for
common materials include:
rubber, ϳ0.5
cork,
ϳ0.0
rock,
ϳ0.1 to 0.3
Rubber is a material that is nearly incompressible:
it maintains a nearly constant volume by thickening just enough to compensate for a given shortening. In contrast, materials like cork or foam rubber,
with a Poisson’s ratio of nearly zero, are said to
be compressible, because they can be shortened
Poisson’s ratio, {ϭ} L 0 ϭ 1
ϭ Ϫ
e p
e a
p ϭ 0, e p ϭ
w Ϫ W
W
8.2 THE IDEALIZED ELASTIC MATERIAL
295
Fig 8.5 Uniaxial compression tests in a stiff testing
machine for four different rock types. Reprinted from Jaeger
and Cook (1979) with the kind permission of Mrs. Jennifer D.
Cook.
–8 –6 –4 –2 0 0
–14
–28
–42
–6 –4 –2 0
0
–70
–140
–210
–280
–6 –4 –2 0 0
–70
–140
–210
–280
–350
–6 –4 –2 0
0
–70
–140
–210
–280
Axial stress (MPa)
Solenhofen
Limestone
Karroo
Dolerite
Rand
Quartzite
Gosford
Sandstone
Axial contraction (x10
–3
)