

stresses in the horizontal plane, S H and S h , respectively, and their orientation (azimuth), (Fig. 6.31b).
It is not known a priori whether S V is the least,
intermediate, or greatest principal stress. It is generally presumed that all of these stresses are compressive, so S H is the greatest compressive stress
and S h is the least compressive stress in the horizontal plane. The pressure record from the
hydraulic fracturing test is used to determine the
magnitudes of these stresses. Their orientation is
determined by assuming that the least compressive stress, S h , is perpendicular to the fracture, and
the fracture orientation is detected in the wellbore
using devices called impression packers or borehole televiewers (Amadei and Stephansson, 1997).
To carry out the hydraulic fracturing procedure a short section of the well is sealed off from
the fluid pressure above and below with so-called
straddle packers, inflatable rubber tubes that
press against the sides of the wellbore (Fig. 6.31a).
The fluid pressure is monitored with an electronic pressure transducer, and it is controlled by
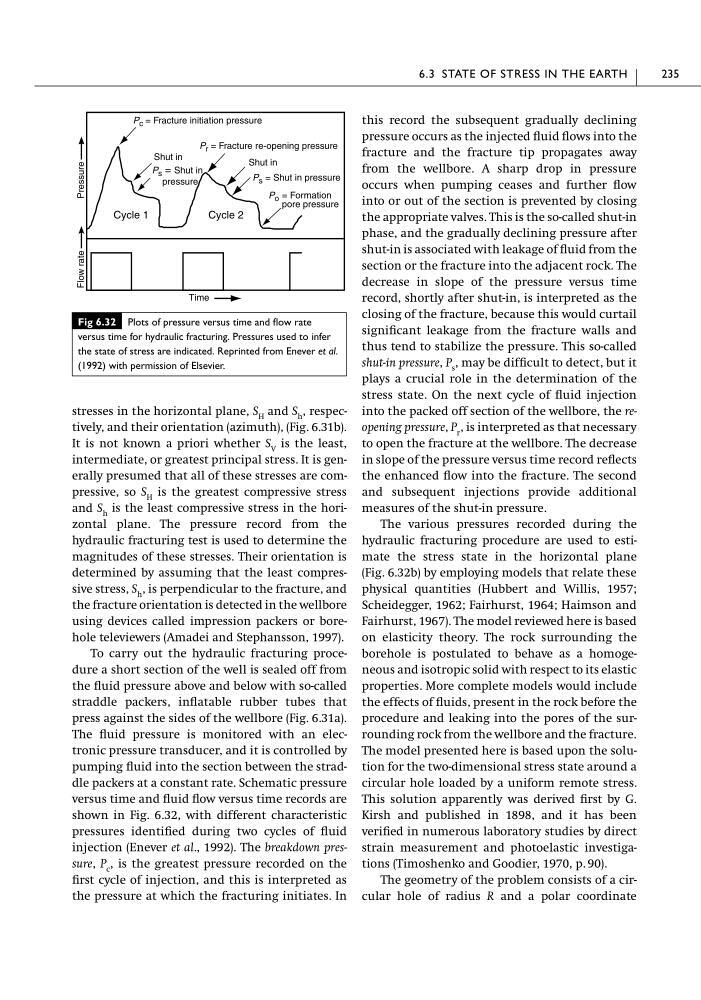
pumping fluid into the section between the straddle packers at a constant rate. Schematic pressure
versus time and fluid flow versus time records are
shown in Fig. 6.32, with different characteristic
pressures identified during two cycles of fluid
injection (Enever et al., 1992). The breakdown pressure, P c , is the greatest pressure recorded on the
first cycle of injection, and this is interpreted as
the pressure at which the fracturing initiates. In
this record the subsequent gradually declining
pressure occurs as the injected fluid flows into the
fracture and the fracture tip propagates away
from the wellbore. A sharp drop in pressure
occurs when pumping ceases and further flow
into or out of the section is prevented by closing
the appropriate valves. This is the so-called shut-in
phase, and the gradually declining pressure after
shut-in is associated with leakage of fluid from the
section or the fracture into the adjacent rock. The
decrease in slope of the pressure versus time
record, shortly after shut-in, is interpreted as the
closing of the fracture, because this would curtail
significant leakage from the fracture walls and
thus tend to stabilize the pressure. This so-called
shut-in pressure, P s , may be difficult to detect, but it
plays a crucial role in the determination of the
stress state. On the next cycle of fluid injection
into the packed off section of the wellbore, the reopening pressure, P r , is interpreted as that necessary
to open the fracture at the wellbore. The decrease
in slope of the pressure versus time record reflects
the enhanced flow into the fracture. The second
and subsequent injections provide additional
measures of the shut-in pressure.
The various pressures recorded during the
hydraulic fracturing procedure are used to estimate the stress state in the horizontal plane
(Fig. 6.32b) by employing models that relate these
physical quantities (Hubbert and Willis, 1957;
Scheidegger, 1962; Fairhurst, 1964; Haimson and
Fairhurst, 1967). The model reviewed here is based
on elasticity theory. The rock surrounding the
borehole is postulated to behave as a homogeneous and isotropic solid with respect to its elastic
properties. More complete models would include
the effects of fluids, present in the rock before the
procedure and leaking into the pores of the surrounding rock from the wellbore and the fracture.
The model presented here is based upon the solution for the two-dimensional stress state around a
circular hole loaded by a uniform remote stress.
This solution apparently was derived first by G.
Kirsh and published in 1898, and it has been
verified in numerous laboratory studies by direct
strain measurement and photoelastic investigations (Timoshenko and Goodier, 1970, p. 90).
The geometry of the problem consists of a circular hole of radius R and a polar coordinate
6.3 STATE OF STRESS IN THE EARTH
235
Fig 6.32 Plots of pressure versus time and flow rate
versus time for hydraulic fracturing. Pressures used to infer
the state of stress are indicated. Reprinted from Enever et al.
(1992) with permission of Elsevier.
P c = Fracture initiation pressure
P r = Fracture re-opening pressure
Shut in
P s = Shut in pressure
P o = Formation
pore pressure
Shut in
P s = Shut in
pressure
Time
Flow rate
Pressure
Cycle 1
Cycle 2
It is not known a priori whether S V is the least,
intermediate, or greatest principal stress. It is generally presumed that all of these stresses are compressive, so S H is the greatest compressive stress
and S h is the least compressive stress in the horizontal plane. The pressure record from the
hydraulic fracturing test is used to determine the
magnitudes of these stresses. Their orientation is
determined by assuming that the least compressive stress, S h , is perpendicular to the fracture, and
the fracture orientation is detected in the wellbore
using devices called impression packers or borehole televiewers (Amadei and Stephansson, 1997).
To carry out the hydraulic fracturing procedure a short section of the well is sealed off from
the fluid pressure above and below with so-called
straddle packers, inflatable rubber tubes that
press against the sides of the wellbore (Fig. 6.31a).
The fluid pressure is monitored with an electronic pressure transducer, and it is controlled by
pumping fluid into the section between the straddle packers at a constant rate. Schematic pressure
versus time and fluid flow versus time records are
shown in Fig. 6.32, with different characteristic
pressures identified during two cycles of fluid
injection (Enever et al., 1992). The breakdown pressure, P c , is the greatest pressure recorded on the
first cycle of injection, and this is interpreted as
the pressure at which the fracturing initiates. In
this record the subsequent gradually declining
pressure occurs as the injected fluid flows into the
fracture and the fracture tip propagates away
from the wellbore. A sharp drop in pressure
occurs when pumping ceases and further flow
into or out of the section is prevented by closing
the appropriate valves. This is the so-called shut-in
phase, and the gradually declining pressure after
shut-in is associated with leakage of fluid from the
section or the fracture into the adjacent rock. The
decrease in slope of the pressure versus time
record, shortly after shut-in, is interpreted as the
closing of the fracture, because this would curtail
significant leakage from the fracture walls and
thus tend to stabilize the pressure. This so-called
shut-in pressure, P s , may be difficult to detect, but it
plays a crucial role in the determination of the
stress state. On the next cycle of fluid injection
into the packed off section of the wellbore, the reopening pressure, P r , is interpreted as that necessary
to open the fracture at the wellbore. The decrease
in slope of the pressure versus time record reflects
the enhanced flow into the fracture. The second
and subsequent injections provide additional
measures of the shut-in pressure.
The various pressures recorded during the
hydraulic fracturing procedure are used to estimate the stress state in the horizontal plane
(Fig. 6.32b) by employing models that relate these
physical quantities (Hubbert and Willis, 1957;
Scheidegger, 1962; Fairhurst, 1964; Haimson and
Fairhurst, 1967). The model reviewed here is based
on elasticity theory. The rock surrounding the
borehole is postulated to behave as a homogeneous and isotropic solid with respect to its elastic
properties. More complete models would include
the effects of fluids, present in the rock before the
procedure and leaking into the pores of the surrounding rock from the wellbore and the fracture.
The model presented here is based upon the solution for the two-dimensional stress state around a
circular hole loaded by a uniform remote stress.
This solution apparently was derived first by G.
Kirsh and published in 1898, and it has been
verified in numerous laboratory studies by direct
strain measurement and photoelastic investigations (Timoshenko and Goodier, 1970, p. 90).
The geometry of the problem consists of a circular hole of radius R and a polar coordinate
6.3 STATE OF STRESS IN THE EARTH
235
Fig 6.32 Plots of pressure versus time and flow rate
versus time for hydraulic fracturing. Pressures used to infer
the state of stress are indicated. Reprinted from Enever et al.
(1992) with permission of Elsevier.
P c = Fracture initiation pressure
P r = Fracture re-opening pressure
Shut in
P s = Shut in pressure
P o = Formation
pore pressure
Shut in
P s = Shut in
pressure
Time
Flow rate
Pressure
Cycle 1
Cycle 2