

origin through the point (x 0 , y 0 , z 0 ) is parallel to
this traction vector (Fig. 6.10b).
The unit normal vector, n, determines the orientation of the tangent plane to the tractiondirector surface at the point (x 0 , y 0 , z 0 ) and this
plane is parallel to the surface on which the traction vector t(n) acts. Given the magnitudes of the
special tractions t 1 , t 2 , and t 3 and the components
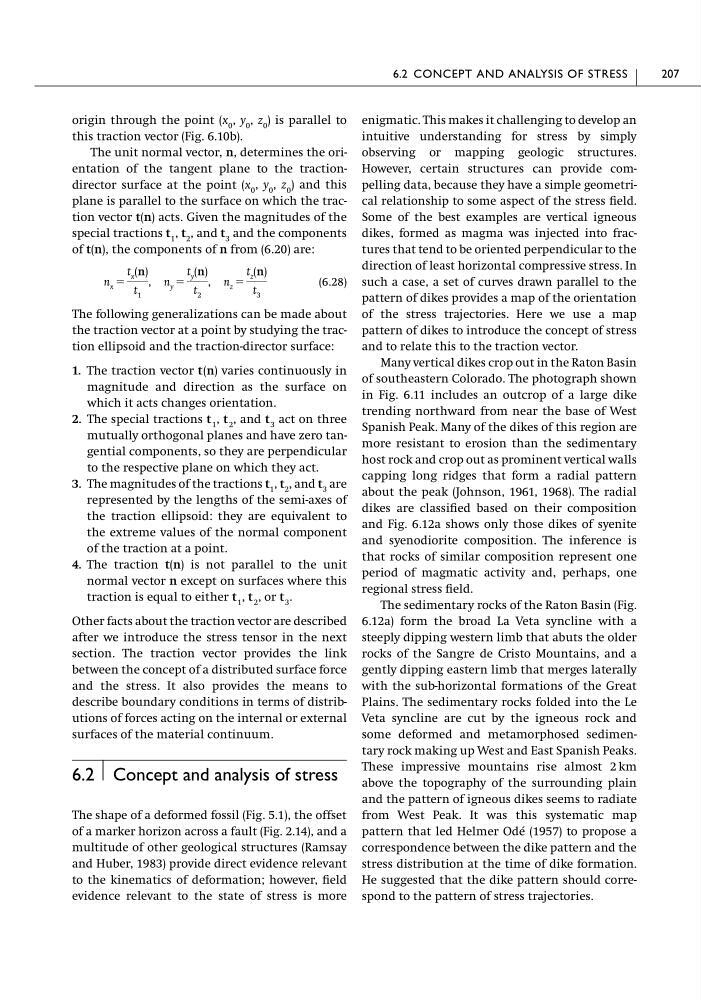
of t(n), the components of n from (6.20) are:
(6.28)
The following generalizations can be made about
the traction vector at a point by studying the traction ellipsoid and the traction-director surface:
1. The traction vector t(n) varies continuously in
magnitude and direction as the surface on
which it acts changes orientation.
2. The special tractions t 1 , t 2 , and t 3 act on three
mutually orthogonal planes and have zero tangential components, so they are perpendicular
to the respective plane on which they act.
3. The magnitudes of the tractions t 1 , t 2 , and t 3 are
represented by the lengths of the semi-axes of
the traction ellipsoid: they are equivalent to
the extreme values of the normal component
of the traction at a point.
4. The traction t(n) is not parallel to the unit
normal vector n except on surfaces where this
traction is equal to either t 1 , t 2 , or t 3 .
Other facts about the traction vector are described
after we introduce the stress tensor in the next
section. The traction vector provides the link
between the concept of a distributed surface force
and the stress. It also provides the means to
describe boundary conditions in terms of distributions of forces acting on the internal or external
surfaces of the material continuum.
6.2 Concept and analysis of stress
The shape of a deformed fossil (Fig. 5.1), the offset
of a marker horizon across a fault (Fig. 2.14), and a
multitude of other geological structures (Ramsay
and Huber, 1983) provide direct evidence relevant
to the kinematics of deformation; however, field
evidence relevant to the state of stress is more
n x ϭ
t x (n)
t 1
, n y ϭ
t y (n)
t 2
, n z ϭ
t z (n)
t 3
enigmatic. This makes it challenging to develop an
intuitive understanding for stress by simply
observing or mapping geologic structures.
However, certain structures can provide compelling data, because they have a simple geometrical relationship to some aspect of the stress field.
Some of the best examples are vertical igneous
dikes, formed as magma was injected into fractures that tend to be oriented perpendicular to the
direction of least horizontal compressive stress. In
such a case, a set of curves drawn parallel to the
pattern of dikes provides a map of the orientation
of the stress trajectories. Here we use a map
pattern of dikes to introduce the concept of stress
and to relate this to the traction vector.
Many vertical dikes crop out in the Raton Basin
of southeastern Colorado. The photograph shown
in Fig. 6.11 includes an outcrop of a large dike
trending northward from near the base of West
Spanish Peak. Many of the dikes of this region are
more resistant to erosion than the sedimentary
host rock and crop out as prominent vertical walls
capping long ridges that form a radial pattern
about the peak (Johnson, 1961, 1968). The radial
dikes are classified based on their composition
and Fig. 6.12a shows only those dikes of syenite
and syenodiorite composition. The inference is
that rocks of similar composition represent one
period of magmatic activity and, perhaps, one
regional stress field.
The sedimentary rocks of the Raton Basin (Fig.
6.12a) form the broad La Veta syncline with a
steeply dipping western limb that abuts the older
rocks of the Sangre de Cristo Mountains, and a
gently dipping eastern limb that merges laterally
with the sub-horizontal formations of the Great
Plains. The sedimentary rocks folded into the Le
Veta syncline are cut by the igneous rock and
some deformed and metamorphosed sedimentary rock making up West and East Spanish Peaks.
These impressive mountains rise almost 2 km
above the topography of the surrounding plain
and the pattern of igneous dikes seems to radiate
from West Peak. It was this systematic map
pattern that led Helmer Odé (1957) to propose a
correspondence between the dike pattern and the
stress distribution at the time of dike formation.
He suggested that the dike pattern should correspond to the pattern of stress trajectories.
6.2 CONCEPT AND ANALYSIS OF STRESS
207
this traction vector (Fig. 6.10b).
The unit normal vector, n, determines the orientation of the tangent plane to the tractiondirector surface at the point (x 0 , y 0 , z 0 ) and this
plane is parallel to the surface on which the traction vector t(n) acts. Given the magnitudes of the
special tractions t 1 , t 2 , and t 3 and the components
of t(n), the components of n from (6.20) are:
(6.28)
The following generalizations can be made about
the traction vector at a point by studying the traction ellipsoid and the traction-director surface:
1. The traction vector t(n) varies continuously in
magnitude and direction as the surface on
which it acts changes orientation.
2. The special tractions t 1 , t 2 , and t 3 act on three
mutually orthogonal planes and have zero tangential components, so they are perpendicular
to the respective plane on which they act.
3. The magnitudes of the tractions t 1 , t 2 , and t 3 are
represented by the lengths of the semi-axes of
the traction ellipsoid: they are equivalent to
the extreme values of the normal component
of the traction at a point.
4. The traction t(n) is not parallel to the unit
normal vector n except on surfaces where this
traction is equal to either t 1 , t 2 , or t 3 .
Other facts about the traction vector are described
after we introduce the stress tensor in the next
section. The traction vector provides the link
between the concept of a distributed surface force
and the stress. It also provides the means to
describe boundary conditions in terms of distributions of forces acting on the internal or external
surfaces of the material continuum.
6.2 Concept and analysis of stress
The shape of a deformed fossil (Fig. 5.1), the offset
of a marker horizon across a fault (Fig. 2.14), and a
multitude of other geological structures (Ramsay
and Huber, 1983) provide direct evidence relevant
to the kinematics of deformation; however, field
evidence relevant to the state of stress is more
n x ϭ
t x (n)
t 1
, n y ϭ
t y (n)
t 2
, n z ϭ
t z (n)
t 3
enigmatic. This makes it challenging to develop an
intuitive understanding for stress by simply
observing or mapping geologic structures.
However, certain structures can provide compelling data, because they have a simple geometrical relationship to some aspect of the stress field.
Some of the best examples are vertical igneous
dikes, formed as magma was injected into fractures that tend to be oriented perpendicular to the
direction of least horizontal compressive stress. In
such a case, a set of curves drawn parallel to the
pattern of dikes provides a map of the orientation
of the stress trajectories. Here we use a map
pattern of dikes to introduce the concept of stress
and to relate this to the traction vector.
Many vertical dikes crop out in the Raton Basin
of southeastern Colorado. The photograph shown
in Fig. 6.11 includes an outcrop of a large dike
trending northward from near the base of West
Spanish Peak. Many of the dikes of this region are
more resistant to erosion than the sedimentary
host rock and crop out as prominent vertical walls
capping long ridges that form a radial pattern
about the peak (Johnson, 1961, 1968). The radial
dikes are classified based on their composition
and Fig. 6.12a shows only those dikes of syenite
and syenodiorite composition. The inference is
that rocks of similar composition represent one
period of magmatic activity and, perhaps, one
regional stress field.
The sedimentary rocks of the Raton Basin (Fig.
6.12a) form the broad La Veta syncline with a
steeply dipping western limb that abuts the older
rocks of the Sangre de Cristo Mountains, and a
gently dipping eastern limb that merges laterally
with the sub-horizontal formations of the Great
Plains. The sedimentary rocks folded into the Le
Veta syncline are cut by the igneous rock and
some deformed and metamorphosed sedimentary rock making up West and East Spanish Peaks.
These impressive mountains rise almost 2 km
above the topography of the surrounding plain
and the pattern of igneous dikes seems to radiate
from West Peak. It was this systematic map
pattern that led Helmer Odé (1957) to propose a
correspondence between the dike pattern and the
stress distribution at the time of dike formation.
He suggested that the dike pattern should correspond to the pattern of stress trajectories.
6.2 CONCEPT AND ANALYSIS OF STRESS
207