

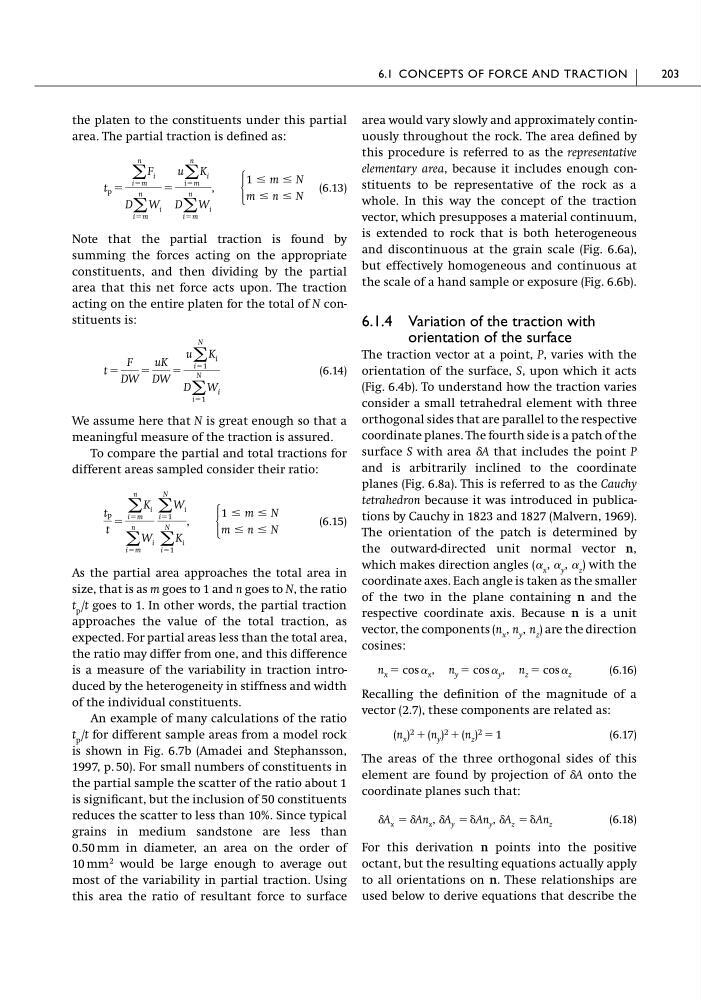
the platen to the constituents under this partial
area. The partial traction is defined as:
(6.13)
Note that the partial traction is found by
summing the forces acting on the appropriate
constituents, and then dividing by the partial
area that this net force acts upon. The traction
acting on the entire platen for the total of N constituents is:
(6.14)
We assume here that N is great enough so that a
meaningful measure of the traction is assured.
To compare the partial and total tractions for
different areas sampled consider their ratio:
(6.15)
As the partial area approaches the total area in
size, that is as m goes to 1 and n goes to N, the ratio
t p /t goes to 1. In other words, the partial traction
approaches the value of the total traction, as
expected. For partial areas less than the total area,
the ratio may differ from one, and this difference
is a measure of the variability in traction introduced by the heterogeneity in stiffness and width
of the individual constituents.
An example of many calculations of the ratio
t p /t for different sample areas from a model rock
is shown in Fig. 6.7b (Amadei and Stephansson,
1997, p. 50). For small numbers of constituents in
the partial sample the scatter of the ratio about 1
is significant, but the inclusion of 50 constituents
reduces the scatter to less than 10%. Since typical
grains in medium sandstone are less than
0.50 mm in diameter, an area on the order of
10 mm
2 would be large enough to average out
most of the variability in partial traction. Using
this area the ratio of resultant force to surface
tp
t
ϭ
͚
n
iϭm
K i
͚
n
iϭm
W i
͚
N
iϭ1
W i
͚
N
iϭ1
K i
, Ά
1 Յ m Յ N
m Յ n Յ N
t ϭ
F
DW
ϭ
uK
DW
ϭ
u ͚
N
iϭ1
K i
D ͚
N
iϭ1
W i
t p ϭ
͚
n
iϭm
F i
D ͚
n
iϭm
W i
ϭ
u ͚
n
iϭm
K i
D ͚
n
iϭm
W i
, Ά
1 Յ m Յ N
m Յ n Յ N
area would vary slowly and approximately continuously throughout the rock. The area defined by
this procedure is referred to as the representative
elementary area, because it includes enough constituents to be representative of the rock as a
whole. In this way the concept of the traction
vector, which presupposes a material continuum,
is extended to rock that is both heterogeneous
and discontinuous at the grain scale (Fig. 6.6a),
but effectively homogeneous and continuous at
the scale of a hand sample or exposure (Fig. 6.6b).
6.1.4 Variation of the traction with
orientation of the surface
The traction vector at a point, P, varies with the
orientation of the surface, S, upon which it acts
(Fig. 6.4b). To understand how the traction varies
consider a small tetrahedral element with three
orthogonal sides that are parallel to the respective
coordinate planes. The fourth side is a patch of the
surface S with area ␦A that includes the point P
and is arbitrarily inclined to the coordinate
planes (Fig. 6.8a). This is referred to as the Cauchy
tetrahedron because it was introduced in publications by Cauchy in 1823 and 1827 (Malvern, 1969).
The orientation of the patch is determined by
the outward-directed unit normal vector n,
which makes direction angles (␣ x , ␣ y , ␣ z ) with the
coordinate axes. Each angle is taken as the smaller
of the two in the plane containing n and the
respective coordinate axis. Because n is a unit
vector, the components (n x , n y , n z ) are the direction
cosines:
(6.16)
Recalling the definition of the magnitude of a
vector (2.7), these components are related as:
(6.17)
The areas of the three orthogonal sides of this
element are found by projection of ␦A onto the
coordinate planes such that:
(6.18)
For this derivation n points into the positive
octant, but the resulting equations actually apply
to all orientations on n. These relationships are
used below to derive equations that describe the
␦A x ϭ ␦An x , ␦A y ϭ ␦An y , ␦A z ϭ ␦An z
(n x ) 2 ϩ (n y ) 2 ϩ (n z ) 2 ϭ 1
n x ϭ cos ␣ x , n y ϭ cos ␣ y , n z ϭ cos ␣ z
6.1 CONCEPTS OF FORCE AND TRACTION
203
area. The partial traction is defined as:
(6.13)
Note that the partial traction is found by
summing the forces acting on the appropriate
constituents, and then dividing by the partial
area that this net force acts upon. The traction
acting on the entire platen for the total of N constituents is:
(6.14)
We assume here that N is great enough so that a
meaningful measure of the traction is assured.
To compare the partial and total tractions for
different areas sampled consider their ratio:
(6.15)
As the partial area approaches the total area in
size, that is as m goes to 1 and n goes to N, the ratio
t p /t goes to 1. In other words, the partial traction
approaches the value of the total traction, as
expected. For partial areas less than the total area,
the ratio may differ from one, and this difference
is a measure of the variability in traction introduced by the heterogeneity in stiffness and width
of the individual constituents.
An example of many calculations of the ratio
t p /t for different sample areas from a model rock
is shown in Fig. 6.7b (Amadei and Stephansson,
1997, p. 50). For small numbers of constituents in
the partial sample the scatter of the ratio about 1
is significant, but the inclusion of 50 constituents
reduces the scatter to less than 10%. Since typical
grains in medium sandstone are less than
0.50 mm in diameter, an area on the order of
10 mm
2 would be large enough to average out
most of the variability in partial traction. Using
this area the ratio of resultant force to surface
tp
t
ϭ
͚
n
iϭm
K i
͚
n
iϭm
W i
͚
N
iϭ1
W i
͚
N
iϭ1
K i
, Ά
1 Յ m Յ N
m Յ n Յ N
t ϭ
F
DW
ϭ
uK
DW
ϭ
u ͚
N
iϭ1
K i
D ͚
N
iϭ1
W i
t p ϭ
͚
n
iϭm
F i
D ͚
n
iϭm
W i
ϭ
u ͚
n
iϭm
K i
D ͚
n
iϭm
W i
, Ά
1 Յ m Յ N
m Յ n Յ N
area would vary slowly and approximately continuously throughout the rock. The area defined by
this procedure is referred to as the representative
elementary area, because it includes enough constituents to be representative of the rock as a
whole. In this way the concept of the traction
vector, which presupposes a material continuum,
is extended to rock that is both heterogeneous
and discontinuous at the grain scale (Fig. 6.6a),
but effectively homogeneous and continuous at
the scale of a hand sample or exposure (Fig. 6.6b).
6.1.4 Variation of the traction with
orientation of the surface
The traction vector at a point, P, varies with the
orientation of the surface, S, upon which it acts
(Fig. 6.4b). To understand how the traction varies
consider a small tetrahedral element with three
orthogonal sides that are parallel to the respective
coordinate planes. The fourth side is a patch of the
surface S with area ␦A that includes the point P
and is arbitrarily inclined to the coordinate
planes (Fig. 6.8a). This is referred to as the Cauchy
tetrahedron because it was introduced in publications by Cauchy in 1823 and 1827 (Malvern, 1969).
The orientation of the patch is determined by
the outward-directed unit normal vector n,
which makes direction angles (␣ x , ␣ y , ␣ z ) with the
coordinate axes. Each angle is taken as the smaller
of the two in the plane containing n and the
respective coordinate axis. Because n is a unit
vector, the components (n x , n y , n z ) are the direction
cosines:
(6.16)
Recalling the definition of the magnitude of a
vector (2.7), these components are related as:
(6.17)
The areas of the three orthogonal sides of this
element are found by projection of ␦A onto the
coordinate planes such that:
(6.18)
For this derivation n points into the positive
octant, but the resulting equations actually apply
to all orientations on n. These relationships are
used below to derive equations that describe the
␦A x ϭ ␦An x , ␦A y ϭ ␦An y , ␦A z ϭ ␦An z
(n x ) 2 ϩ (n y ) 2 ϩ (n z ) 2 ϭ 1
n x ϭ cos ␣ x , n y ϭ cos ␣ y , n z ϭ cos ␣ z
6.1 CONCEPTS OF FORCE AND TRACTION
203