

across the fault trace. The farmers, homeowners,
businesses, and municipalities in the Imperial
Valley, mostly around the town of El Centro, sustained over twenty million dollars in damage.
Fortunately, there was no loss of life and few catastrophic failures of man-made structures in this
event. On the other hand, earthquakes of similar
magnitude often are accompanied by many
deaths in regions with less stringent building
codes, or no building codes at all. These events
testify to the destructive power of earthquakes
and to the need to understand such hazards.
Because earthquakes are generated by sudden slip
on faults, we need to understand the mechanisms
and behaviors of faults in order to develop
informed hazard mitigation policy. Just what are
the causes and consequences of dynamic rupture
on faults? Some answers to this question have
come from research by scientists and engineers
over the past few decades, but much remains to be
understood.
In the previous section we described how geologists, geodesists, and geophysicists use models to
extrapolate information on displacements or
accelerations from the locations where data are
measured on the Earth’s surface to the fault in the
sub-surface. These models help us to understand
the behavior of faults where they cannot be
observed directly and they provide insights
concerning earthquake faulting as a structural
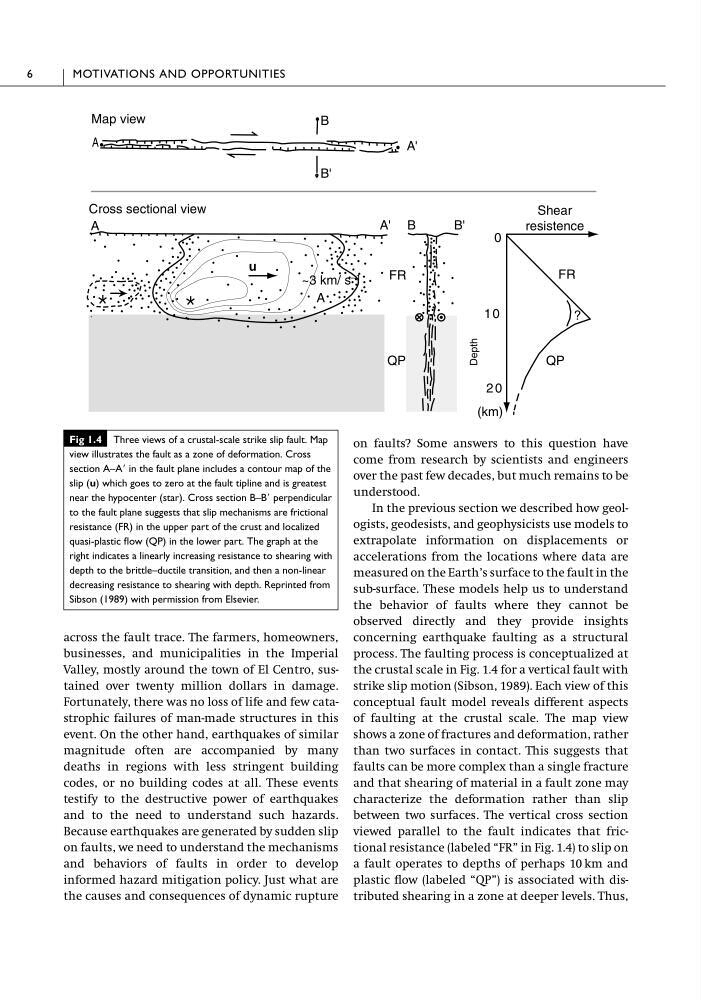
process. The faulting process is conceptualized at
the crustal scale in Fig. 1.4 for a vertical fault with
strike slip motion (Sibson, 1989). Each view of this
conceptual fault model reveals different aspects
of faulting at the crustal scale. The map view
shows a zone of fractures and deformation, rather
than two surfaces in contact. This suggests that
faults can be more complex than a single fracture
and that shearing of material in a fault zone may
characterize the deformation rather than slip
between two surfaces. The vertical cross section
viewed parallel to the fault indicates that frictional resistance (labeled “FR” in Fig. 1.4) to slip on
a fault operates to depths of perhaps 10 km and
plastic flow (labeled “QP”) is associated with distributed shearing in a zone at deeper levels. Thus,
6
MOTIVATIONS AND OPPORTUNITIES
u
QP
FR
B
B'
B'
B
A
A'
Cross sectional view
?
A
QP
FR
0
10
20
A'
A
(km)
Shear
resistence
Map view
~3 km/ s –1
Depth
Fig 1.4 Three views of a crustal-scale strike slip fault. Map
view illustrates the fault as a zone of deformation. Cross
section A–AЈ in the fault plane includes a contour map of the
slip (u) which goes to zero at the fault tipline and is greatest
near the hypocenter (star). Cross section B–BЈ perpendicular
to the fault plane suggests that slip mechanisms are frictional
resistance (FR) in the upper part of the crust and localized
quasi-plastic flow (QP) in the lower part. The graph at the
right indicates a linearly increasing resistance to shearing with
depth to the brittle–ductile transition, and then a non-linear
decreasing resistance to shearing with depth. Reprinted from
Sibson (1989) with permission from Elsevier.
businesses, and municipalities in the Imperial
Valley, mostly around the town of El Centro, sustained over twenty million dollars in damage.
Fortunately, there was no loss of life and few catastrophic failures of man-made structures in this
event. On the other hand, earthquakes of similar
magnitude often are accompanied by many
deaths in regions with less stringent building
codes, or no building codes at all. These events
testify to the destructive power of earthquakes
and to the need to understand such hazards.
Because earthquakes are generated by sudden slip
on faults, we need to understand the mechanisms
and behaviors of faults in order to develop
informed hazard mitigation policy. Just what are
the causes and consequences of dynamic rupture
on faults? Some answers to this question have
come from research by scientists and engineers
over the past few decades, but much remains to be
understood.
In the previous section we described how geologists, geodesists, and geophysicists use models to
extrapolate information on displacements or
accelerations from the locations where data are
measured on the Earth’s surface to the fault in the
sub-surface. These models help us to understand
the behavior of faults where they cannot be
observed directly and they provide insights
concerning earthquake faulting as a structural
process. The faulting process is conceptualized at
the crustal scale in Fig. 1.4 for a vertical fault with
strike slip motion (Sibson, 1989). Each view of this
conceptual fault model reveals different aspects
of faulting at the crustal scale. The map view
shows a zone of fractures and deformation, rather
than two surfaces in contact. This suggests that
faults can be more complex than a single fracture
and that shearing of material in a fault zone may
characterize the deformation rather than slip
between two surfaces. The vertical cross section
viewed parallel to the fault indicates that frictional resistance (labeled “FR” in Fig. 1.4) to slip on
a fault operates to depths of perhaps 10 km and
plastic flow (labeled “QP”) is associated with distributed shearing in a zone at deeper levels. Thus,
6
MOTIVATIONS AND OPPORTUNITIES
u
QP
FR
B
B'
B'
B
A
A'
Cross sectional view
?
A
QP
FR
0
10
20
A'
A
(km)
Shear
resistence
Map view
~3 km/ s –1
Depth
Fig 1.4 Three views of a crustal-scale strike slip fault. Map
view illustrates the fault as a zone of deformation. Cross
section A–AЈ in the fault plane includes a contour map of the
slip (u) which goes to zero at the fault tipline and is greatest
near the hypocenter (star). Cross section B–BЈ perpendicular
to the fault plane suggests that slip mechanisms are frictional
resistance (FR) in the upper part of the crust and localized
quasi-plastic flow (QP) in the lower part. The graph at the
right indicates a linearly increasing resistance to shearing with
depth to the brittle–ductile transition, and then a non-linear
decreasing resistance to shearing with depth. Reprinted from
Sibson (1989) with permission from Elsevier.