

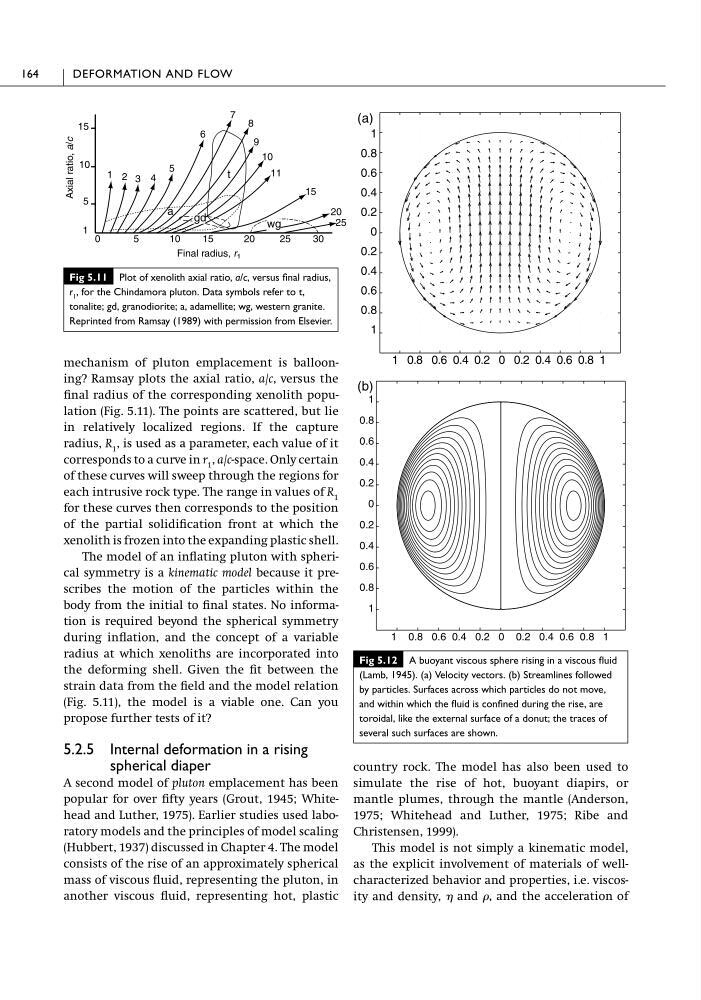
mechanism of pluton emplacement is ballooning? Ramsay plots the axial ratio, a/c, versus the
final radius of the corresponding xenolith population (Fig. 5.11). The points are scattered, but lie
in relatively localized regions. If the capture
radius, R 1 , is used as a parameter, each value of it
corresponds to a curve in r 1 , a/c-space. Only certain
of these curves will sweep through the regions for
each intrusive rock type. The range in values of R 1
for these curves then corresponds to the position
of the partial solidification front at which the
xenolith is frozen into the expanding plastic shell.
The model of an inflating pluton with spherical symmetry is a kinematic model because it prescribes the motion of the particles within the
body from the initial to final states. No information is required beyond the spherical symmetry
during inflation, and the concept of a variable
radius at which xenoliths are incorporated into
the deforming shell. Given the fit between the
strain data from the field and the model relation
(Fig. 5.11), the model is a viable one. Can you
propose further tests of it?
5.2.5 Internal deformation in a rising
spherical diaper
A second model of pluton emplacement has been
popular for over fifty years (Grout, 1945; Whitehead and Luther, 1975). Earlier studies used laboratory models and the principles of model scaling
(Hubbert, 1937) discussed in Chapter 4. The model
consists of the rise of an approximately spherical
mass of viscous fluid, representing the pluton, in
another viscous fluid, representing hot, plastic
country rock. The model has also been used to
simulate the rise of hot, buoyant diapirs, or
mantle plumes, through the mantle (Anderson,
1975; Whitehead and Luther, 1975; Ribe and
Christensen, 1999).
This model is not simply a kinematic model,
as the explicit involvement of materials of wellcharacterized behavior and properties, i.e. viscosity and density, and , and the acceleration of
164
DEFORMATION AND FLOW
Fig 5.11 Plot of xenolith axial ratio, a/c, versus final radius,
r 1 , for the Chindamora pluton. Data symbols refer to t,
tonalite; gd, granodiorite; a, adamellite; wg, western granite.
Reprinted from Ramsay (1989) with permission from Elsevier.
1 2 3 4
5
6
7 8
9
10
11
15
20
25
15
10
Axial ratio,
a/c
Final radius, r 1
5
1
t
a
gd
0
5
10
15
20
25
30
wg
Fig 5.12 A buoyant viscous sphere rising in a viscous fluid
(Lamb, 1945). (a) Velocity vectors. (b) Streamlines followed
by particles. Surfaces across which particles do not move,
and within which the fluid is confined during the rise, are
toroidal, like the external surface of a donut; the traces of
several such surfaces are shown.
1
0.8
0.6
0.4
0.2
0
0.2
0.4
0.6
0.8
1
1 0.8 0.6 0.4 0.2 0 0.2 0.4 0.6 0.8 1
1
0.8
0.6
0.4
0.2
0
0.2
0.4
0.6
0.8
1
1 0.8 0.6 0.4 0.2 0 0.2 0.4 0.6 0.8 1
(a)
(b)
final radius of the corresponding xenolith population (Fig. 5.11). The points are scattered, but lie
in relatively localized regions. If the capture
radius, R 1 , is used as a parameter, each value of it
corresponds to a curve in r 1 , a/c-space. Only certain
of these curves will sweep through the regions for
each intrusive rock type. The range in values of R 1
for these curves then corresponds to the position
of the partial solidification front at which the
xenolith is frozen into the expanding plastic shell.
The model of an inflating pluton with spherical symmetry is a kinematic model because it prescribes the motion of the particles within the
body from the initial to final states. No information is required beyond the spherical symmetry
during inflation, and the concept of a variable
radius at which xenoliths are incorporated into
the deforming shell. Given the fit between the
strain data from the field and the model relation
(Fig. 5.11), the model is a viable one. Can you
propose further tests of it?
5.2.5 Internal deformation in a rising
spherical diaper
A second model of pluton emplacement has been
popular for over fifty years (Grout, 1945; Whitehead and Luther, 1975). Earlier studies used laboratory models and the principles of model scaling
(Hubbert, 1937) discussed in Chapter 4. The model
consists of the rise of an approximately spherical
mass of viscous fluid, representing the pluton, in
another viscous fluid, representing hot, plastic
country rock. The model has also been used to
simulate the rise of hot, buoyant diapirs, or
mantle plumes, through the mantle (Anderson,
1975; Whitehead and Luther, 1975; Ribe and
Christensen, 1999).
This model is not simply a kinematic model,
as the explicit involvement of materials of wellcharacterized behavior and properties, i.e. viscosity and density, and , and the acceleration of
164
DEFORMATION AND FLOW
Fig 5.11 Plot of xenolith axial ratio, a/c, versus final radius,
r 1 , for the Chindamora pluton. Data symbols refer to t,
tonalite; gd, granodiorite; a, adamellite; wg, western granite.
Reprinted from Ramsay (1989) with permission from Elsevier.
1 2 3 4
5
6
7 8
9
10
11
15
20
25
15
10
Axial ratio,
a/c
Final radius, r 1
5
1
t
a
gd
0
5
10
15
20
25
30
wg
Fig 5.12 A buoyant viscous sphere rising in a viscous fluid
(Lamb, 1945). (a) Velocity vectors. (b) Streamlines followed
by particles. Surfaces across which particles do not move,
and within which the fluid is confined during the rise, are
toroidal, like the external surface of a donut; the traces of
several such surfaces are shown.
1
0.8
0.6
0.4
0.2
0
0.2
0.4
0.6
0.8
1
1 0.8 0.6 0.4 0.2 0 0.2 0.4 0.6 0.8 1
1
0.8
0.6
0.4
0.2
0
0.2
0.4
0.6
0.8
1
1 0.8 0.6 0.4 0.2 0 0.2 0.4 0.6 0.8 1
(a)
(b)