

dimensions of length: this equation is dimensionally homogeneous.
4.2.2 Dimensionless equations and graphs
Having corrected dimensional inconsistencies,
the next step in the analysis of an unfamiliar
equation is to plot it in graphical form so you can
visualize the relationships between the different
variables. For other than the simplest equations
with one dependent and one independent variable, there are several possibilities for plotting
graphs. Here we introduce the concept of dimensionless equations and graphs because they turn
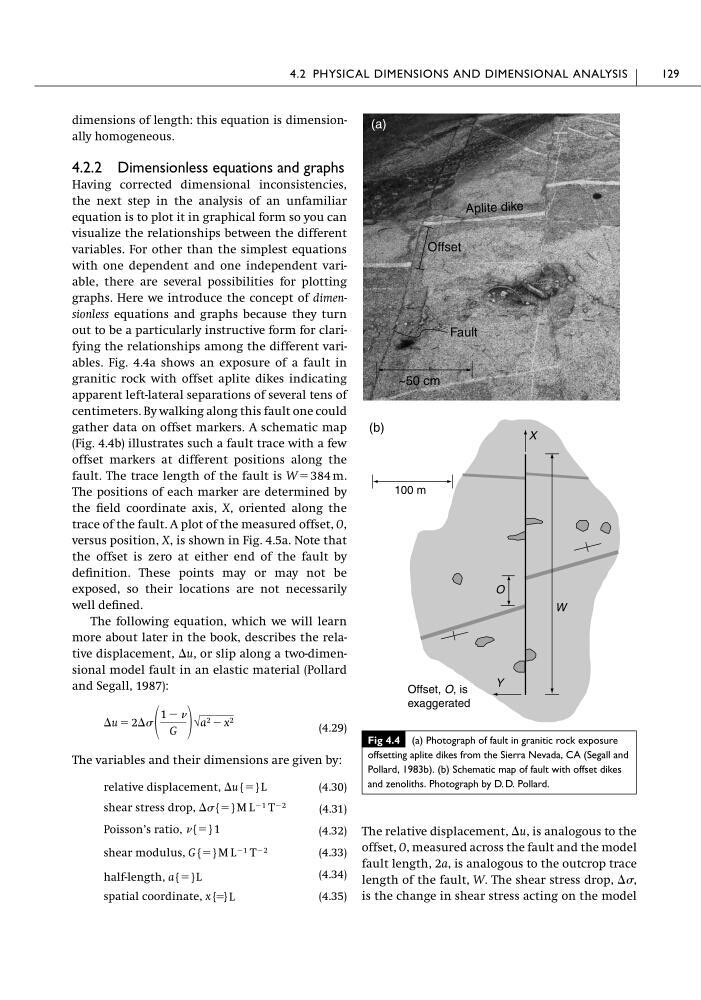
out to be a particularly instructive form for clarifying the relationships among the different variables. Fig. 4.4a shows an exposure of a fault in
granitic rock with offset aplite dikes indicating
apparent left-lateral separations of several tens of
centimeters. By walking along this fault one could
gather data on offset markers. A schematic map
(Fig. 4.4b) illustrates such a fault trace with a few
offset markers at different positions along the
fault. The trace length of the fault is W ϭ 384 m.
The positions of each marker are determined by
the field coordinate axis, X, oriented along the
trace of the fault. A plot of the measured offset, O,
versus position, X, is shown in Fig. 4.5a. Note that
the offset is zero at either end of the fault by
definition. These points may or may not be
exposed, so their locations are not necessarily
well defined.
The following equation, which we will learn
more about later in the book, describes the relative displacement, ⌬u, or slip along a two-dimensional model fault in an elastic material (Pollard
and Segall, 1987):
(4.29)
The variables and their dimensions are given by:
(4.30)
(4.31)
Poisson’s ratio,
(4.32)
(4.33)
half-length, a{ϭ}L
(4.34)
(4.35)
spatial coordinate, x{ϭ}L
shear modulus, G{ϭ}M L Ϫ1 T Ϫ2
{ϭ}1
shear stress drop, ⌬{ϭ}M L Ϫ1 T Ϫ2
relative displacement, ⌬u{ϭ}L
⌬u ϭ 2⌬
1 Ϫ
G
√a 2 Ϫ x 2
The relative displacement, ⌬u, is analogous to the
offset, O, measured across the fault and the model
fault length, 2a, is analogous to the outcrop trace
length of the fault, W. The shear stress drop, ⌬,
is the change in shear stress acting on the model
4.2 PHYSICAL DIMENSIONS AND DIMENSIONAL ANALYSIS
129
Fig 4.4 (a) Photograph of fault in granitic rock exposure
offsetting aplite dikes from the Sierra Nevada, CA (Segall and
Pollard, 1983b). (b) Schematic map of fault with offset dikes
and zenoliths. Photograph by D. D. Pollard.
100 m
Offset, O, is
exaggerated
(b)
~50 cm
Aplite dike
Fault
Offset
W
O
X
Y
(a)
4.2.2 Dimensionless equations and graphs
Having corrected dimensional inconsistencies,
the next step in the analysis of an unfamiliar
equation is to plot it in graphical form so you can
visualize the relationships between the different
variables. For other than the simplest equations
with one dependent and one independent variable, there are several possibilities for plotting
graphs. Here we introduce the concept of dimensionless equations and graphs because they turn
out to be a particularly instructive form for clarifying the relationships among the different variables. Fig. 4.4a shows an exposure of a fault in
granitic rock with offset aplite dikes indicating
apparent left-lateral separations of several tens of
centimeters. By walking along this fault one could
gather data on offset markers. A schematic map
(Fig. 4.4b) illustrates such a fault trace with a few
offset markers at different positions along the
fault. The trace length of the fault is W ϭ 384 m.
The positions of each marker are determined by
the field coordinate axis, X, oriented along the
trace of the fault. A plot of the measured offset, O,
versus position, X, is shown in Fig. 4.5a. Note that
the offset is zero at either end of the fault by
definition. These points may or may not be
exposed, so their locations are not necessarily
well defined.
The following equation, which we will learn
more about later in the book, describes the relative displacement, ⌬u, or slip along a two-dimensional model fault in an elastic material (Pollard
and Segall, 1987):
(4.29)
The variables and their dimensions are given by:
(4.30)
(4.31)
Poisson’s ratio,
(4.32)
(4.33)
half-length, a{ϭ}L
(4.34)
(4.35)
spatial coordinate, x{ϭ}L
shear modulus, G{ϭ}M L Ϫ1 T Ϫ2
{ϭ}1
shear stress drop, ⌬{ϭ}M L Ϫ1 T Ϫ2
relative displacement, ⌬u{ϭ}L
⌬u ϭ 2⌬
1 Ϫ
G
√a 2 Ϫ x 2
The relative displacement, ⌬u, is analogous to the
offset, O, measured across the fault and the model
fault length, 2a, is analogous to the outcrop trace
length of the fault, W. The shear stress drop, ⌬,
is the change in shear stress acting on the model
4.2 PHYSICAL DIMENSIONS AND DIMENSIONAL ANALYSIS
129
Fig 4.4 (a) Photograph of fault in granitic rock exposure
offsetting aplite dikes from the Sierra Nevada, CA (Segall and
Pollard, 1983b). (b) Schematic map of fault with offset dikes
and zenoliths. Photograph by D. D. Pollard.
100 m
Offset, O, is
exaggerated
(b)
~50 cm
Aplite dike
Fault
Offset
W
O
X
Y
(a)