

data set consists of 5244 points measured with a
laser scanner that cover a small portion of the
main joint surface, a portion of the breakdown
zone, most of one coarse hackle in the fringe
region, and the adjacent cross fractures. An
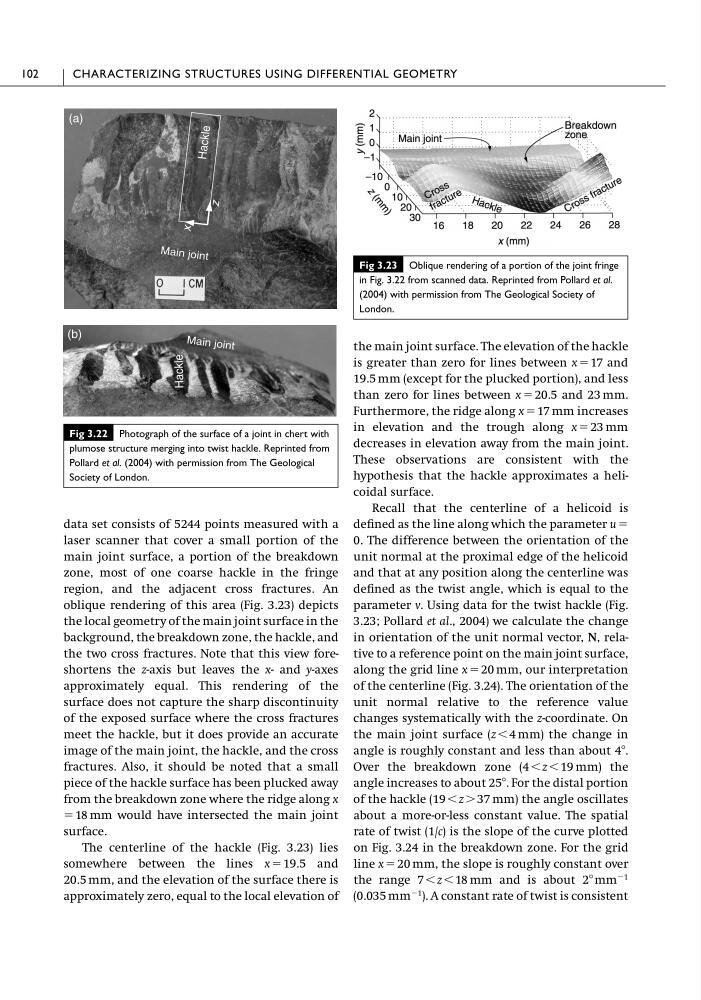
oblique rendering of this area (Fig. 3.23) depicts
the local geometry of the main joint surface in the
background, the breakdown zone, the hackle, and
the two cross fractures. Note that this view foreshortens the z-axis but leaves the x- and y-axes
approximately equal. This rendering of the
surface does not capture the sharp discontinuity
of the exposed surface where the cross fractures
meet the hackle, but it does provide an accurate
image of the main joint, the hackle, and the cross
fractures. Also, it should be noted that a small
piece of the hackle surface has been plucked away
from the breakdown zone where the ridge along x
ϭ 18 mm would have intersected the main joint
surface.
The centerline of the hackle (Fig. 3.23) lies
somewhere between the lines x ϭ 19.5 and
20.5 mm, and the elevation of the surface there is
approximately zero, equal to the local elevation of
the main joint surface. The elevation of the hackle
is greater than zero for lines between x ϭ 17 and
19.5 mm (except for the plucked portion), and less
than zero for lines between x ϭ 20.5 and 23 mm.
Furthermore, the ridge along x ϭ 17 mm increases
in elevation and the trough along x ϭ 23 mm
decreases in elevation away from the main joint.
These observations are consistent with the
hypothesis that the hackle approximates a helicoidal surface.
Recall that the centerline of a helicoid is
defined as the line along which the parameter u ϭ
0. The difference between the orientation of the
unit normal at the proximal edge of the helicoid
and that at any position along the centerline was
defined as the twist angle, which is equal to the
parameter v. Using data for the twist hackle (Fig.
3.23; Pollard et al., 2004) we calculate the change
in orientation of the unit normal vector, N, relative to a reference point on the main joint surface,
along the grid line x ϭ 20 mm, our interpretation
of the centerline (Fig. 3.24). The orientation of the
unit normal relative to the reference value
changes systematically with the z-coordinate. On
the main joint surface (z Ͻ 4 mm) the change in
angle is roughly constant and less than about 4Њ.
Over the breakdown zone (4 Ͻ z Ͻ 19 mm) the
angle increases to about 25Њ. For the distal portion
of the hackle (19 Ͻ z Ͼ 37 mm) the angle oscillates
about a more-or-less constant value. The spatial
rate of twist (1/c) is the slope of the curve plotted
on Fig. 3.24 in the breakdown zone. For the grid
line x ϭ 20 mm, the slope is roughly constant over
the range 7 Ͻ z Ͻ 18 mm and is about 2Њ mm
Ϫ1
(0.035 mm
Ϫ1 ). A constant rate of twist is consistent
102
CHARACTERIZING STRUCTURES USING DIFFERENTIAL GEOMETRY
Fig 3.22 Photograph of the surface of a joint in chert with
plumose structure merging into twist hackle. Reprinted from
Pollard et al. (2004) with permission from The Geological
Society of London.
z
x
Ma in joi nt
Ha ck le
(a)
(b)
Ma in joi nt
Hackle
Fig 3.23 Oblique rendering of a portion of the joint fringe
in Fig. 3.22 from scanned data. Reprinted from Pollard et al.
(2004) with permission from The Geological Society of
London.
laser scanner that cover a small portion of the
main joint surface, a portion of the breakdown
zone, most of one coarse hackle in the fringe
region, and the adjacent cross fractures. An
oblique rendering of this area (Fig. 3.23) depicts
the local geometry of the main joint surface in the
background, the breakdown zone, the hackle, and
the two cross fractures. Note that this view foreshortens the z-axis but leaves the x- and y-axes
approximately equal. This rendering of the
surface does not capture the sharp discontinuity
of the exposed surface where the cross fractures
meet the hackle, but it does provide an accurate
image of the main joint, the hackle, and the cross
fractures. Also, it should be noted that a small
piece of the hackle surface has been plucked away
from the breakdown zone where the ridge along x
ϭ 18 mm would have intersected the main joint
surface.
The centerline of the hackle (Fig. 3.23) lies
somewhere between the lines x ϭ 19.5 and
20.5 mm, and the elevation of the surface there is
approximately zero, equal to the local elevation of
the main joint surface. The elevation of the hackle
is greater than zero for lines between x ϭ 17 and
19.5 mm (except for the plucked portion), and less
than zero for lines between x ϭ 20.5 and 23 mm.
Furthermore, the ridge along x ϭ 17 mm increases
in elevation and the trough along x ϭ 23 mm
decreases in elevation away from the main joint.
These observations are consistent with the
hypothesis that the hackle approximates a helicoidal surface.
Recall that the centerline of a helicoid is
defined as the line along which the parameter u ϭ
0. The difference between the orientation of the
unit normal at the proximal edge of the helicoid
and that at any position along the centerline was
defined as the twist angle, which is equal to the
parameter v. Using data for the twist hackle (Fig.
3.23; Pollard et al., 2004) we calculate the change
in orientation of the unit normal vector, N, relative to a reference point on the main joint surface,
along the grid line x ϭ 20 mm, our interpretation
of the centerline (Fig. 3.24). The orientation of the
unit normal relative to the reference value
changes systematically with the z-coordinate. On
the main joint surface (z Ͻ 4 mm) the change in
angle is roughly constant and less than about 4Њ.
Over the breakdown zone (4 Ͻ z Ͻ 19 mm) the
angle increases to about 25Њ. For the distal portion
of the hackle (19 Ͻ z Ͼ 37 mm) the angle oscillates
about a more-or-less constant value. The spatial
rate of twist (1/c) is the slope of the curve plotted
on Fig. 3.24 in the breakdown zone. For the grid
line x ϭ 20 mm, the slope is roughly constant over
the range 7 Ͻ z Ͻ 18 mm and is about 2Њ mm
Ϫ1
(0.035 mm
Ϫ1 ). A constant rate of twist is consistent
102
CHARACTERIZING STRUCTURES USING DIFFERENTIAL GEOMETRY
Fig 3.22 Photograph of the surface of a joint in chert with
plumose structure merging into twist hackle. Reprinted from
Pollard et al. (2004) with permission from The Geological
Society of London.
z
x
Ma in joi nt
Ha ck le
(a)
(b)
Ma in joi nt
Hackle
Fig 3.23 Oblique rendering of a portion of the joint fringe
in Fig. 3.22 from scanned data. Reprinted from Pollard et al.
(2004) with permission from The Geological Society of
London.