

494
G. Romanescu and I. Minea
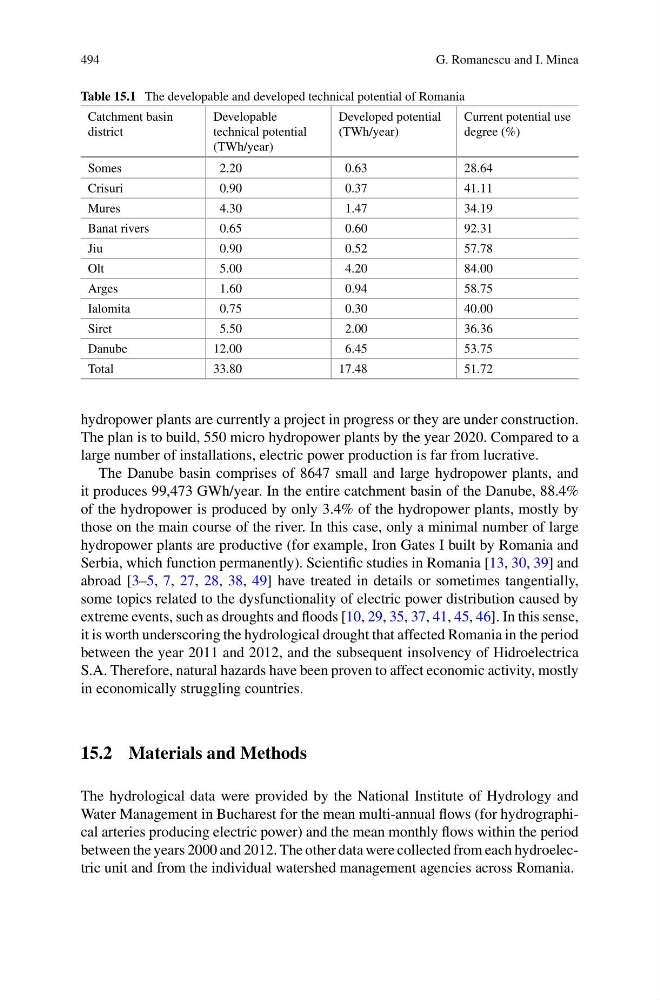
Table 15.1 The developable and developed technical potential of Romania
Catchment basin
district
Developable
technical potential
(TWh/year)
Developed potential
(TWh/year)
Current potential use
degree (%)
Somes
2.20
0.63
28.64
Crisuri
0.90
0.37
41.11
Mures
4.30
1.47
34.19
Banat rivers
0.65
0.60
92.31
Jiu
0.90
0.52
57.78
Olt
5.00
4.20
84.00
Arges
1.60
0.94
58.75
Ialomita
0.75
0.30
40.00
Siret
5.50
2.00
36.36
Danube
12.00
6.45
53.75
Total
33.80
17.48
51.72
hydropower plants are currently a project in progress or they are under construction.
The plan is to build, 550 micro hydropower plants by the year 2020. Compared to a
large number of installations, electric power production is far from lucrative.
The Danube basin comprises of 8647 small and large hydropower plants, and
it produces 99,473 GWh/year. In the entire catchment basin of the Danube, 88.4%
of the hydropower is produced by only 3.4% of the hydropower plants, mostly by
those on the main course of the river. In this case, only a minimal number of large
hydropower plants are productive (for example, Iron Gates I built by Romania and
Serbia, which function permanently). Scientific studies in Romania [13, 30, 39] and
abroad [3–5, 7, 27, 28, 38, 49] have treated in details or sometimes tangentially,
some topics related to the dysfunctionality of electric power distribution caused by
extreme events, such as droughts and floods [10, 29, 35, 37, 41, 45, 46]. In this sense,
it is worth underscoring the hydrological drought that affected Romania in the period
between the year 2011 and 2012, and the subsequent insolvency of Hidroelectrica
S.A. Therefore, natural hazards have been proven to affect economic activity, mostly
in economically struggling countries.
15.2 Materials and Methods
The hydrological data were provided by the National Institute of Hydrology and
Water Management in Bucharest for the mean multi-annual flows (for hydrographical arteries producing electric power) and the mean monthly flows within the period
between the years 2000 and 2012. The other data were collected from each hydroelectric unit and from the individual watershed management agencies across Romania.
G. Romanescu and I. Minea
Table 15.1 The developable and developed technical potential of Romania
Catchment basin
district
Developable
technical potential
(TWh/year)
Developed potential
(TWh/year)
Current potential use
degree (%)
Somes
2.20
0.63
28.64
Crisuri
0.90
0.37
41.11
Mures
4.30
1.47
34.19
Banat rivers
0.65
0.60
92.31
Jiu
0.90
0.52
57.78
Olt
5.00
4.20
84.00
Arges
1.60
0.94
58.75
Ialomita
0.75
0.30
40.00
Siret
5.50
2.00
36.36
Danube
12.00
6.45
53.75
Total
33.80
17.48
51.72
hydropower plants are currently a project in progress or they are under construction.
The plan is to build, 550 micro hydropower plants by the year 2020. Compared to a
large number of installations, electric power production is far from lucrative.
The Danube basin comprises of 8647 small and large hydropower plants, and
it produces 99,473 GWh/year. In the entire catchment basin of the Danube, 88.4%
of the hydropower is produced by only 3.4% of the hydropower plants, mostly by
those on the main course of the river. In this case, only a minimal number of large
hydropower plants are productive (for example, Iron Gates I built by Romania and
Serbia, which function permanently). Scientific studies in Romania [13, 30, 39] and
abroad [3–5, 7, 27, 28, 38, 49] have treated in details or sometimes tangentially,
some topics related to the dysfunctionality of electric power distribution caused by
extreme events, such as droughts and floods [10, 29, 35, 37, 41, 45, 46]. In this sense,
it is worth underscoring the hydrological drought that affected Romania in the period
between the year 2011 and 2012, and the subsequent insolvency of Hidroelectrica
S.A. Therefore, natural hazards have been proven to affect economic activity, mostly
in economically struggling countries.
15.2 Materials and Methods
The hydrological data were provided by the National Institute of Hydrology and
Water Management in Bucharest for the mean multi-annual flows (for hydrographical arteries producing electric power) and the mean monthly flows within the period
between the years 2000 and 2012. The other data were collected from each hydroelectric unit and from the individual watershed management agencies across Romania.